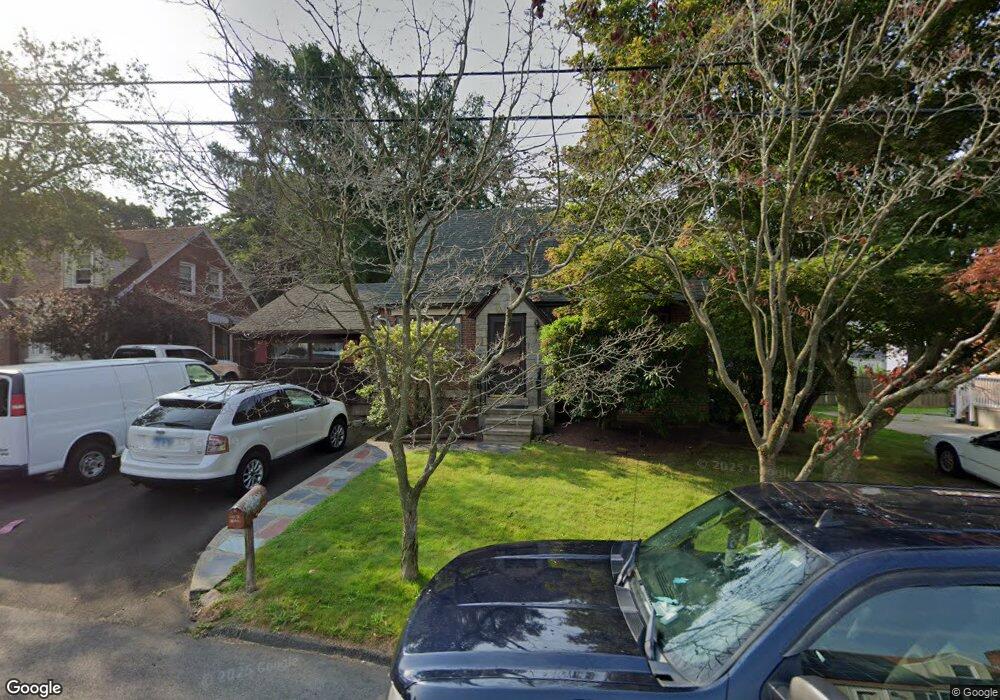
66 W Prospect St West Haven, CT 06516
West Haven Center NeighborhoodEstimated Value: $364,897 - $410,000
3
Beds
3
Baths
1,724
Sq Ft
$228/Sq Ft
Est. Value
About This Home
This home is located at 66 W Prospect St, West Haven, CT 06516 and is currently estimated at $393,724, approximately $228 per square foot. 66 W Prospect St is a home located in New Haven County with nearby schools including Carrigan 5/6 Intermediate School, Harry M. Bailey Middle School, and West Haven High School.
Ownership History
Date
Name
Owned For
Owner Type
Purchase Details
Closed on
Feb 17, 2021
Sold by
Montesi Florence
Bought by
Montesi Mark L
Current Estimated Value
Create a Home Valuation Report for This Property
The Home Valuation Report is an in-depth analysis detailing your home's value as well as a comparison with similar homes in the area
Home Values in the Area
Average Home Value in this Area
Purchase History
| Date | Buyer | Sale Price | Title Company |
|---|---|---|---|
| Montesi Mark L | -- | None Available | |
| Montesi Mark L | -- | None Available |
Source: Public Records
Tax History Compared to Growth
Tax History
| Year | Tax Paid | Tax Assessment Tax Assessment Total Assessment is a certain percentage of the fair market value that is determined by local assessors to be the total taxable value of land and additions on the property. | Land | Improvement |
|---|---|---|---|---|
| 2025 | $7,191 | $208,250 | $64,260 | $143,990 |
| 2024 | $6,647 | $136,990 | $44,520 | $92,470 |
| 2023 | $6,371 | $136,990 | $44,520 | $92,470 |
| 2022 | $6,247 | $136,990 | $44,520 | $92,470 |
| 2021 | $6,247 | $136,990 | $44,520 | $92,470 |
| 2020 | $6,013 | $119,140 | $36,120 | $83,020 |
| 2019 | $5,799 | $119,140 | $36,120 | $83,020 |
| 2018 | $5,749 | $119,140 | $36,120 | $83,020 |
| 2017 | $5,440 | $119,140 | $36,120 | $83,020 |
| 2016 | $5,428 | $119,140 | $36,120 | $83,020 |
| 2015 | $5,019 | $124,390 | $38,780 | $85,610 |
| 2014 | $4,988 | $124,390 | $38,780 | $85,610 |
Source: Public Records
Map
Nearby Homes
- 96 Collis St
- 166 Saw Mill Rd
- 12 Linda St
- 52 Saw Mill Rd
- 227 W Spring St
- 161 W Spring St Unit B2
- 161 W Spring St Unit C1
- 805 Savin Ave
- 782 Savin Ave
- 29 Abner St
- 56 Edward St
- 89 Coleman St Unit 213
- 28 Wharton St
- 327 Center St
- 387 W Spring St
- 24 George St
- 63 Glade St Unit C1
- 677 Washington Ave
- 246 Elm St
- 35 Terrace Ave
- 56 W Prospect St
- 11 Oleander St
- 68 W Prospect St
- 231 York St
- 227 York St
- 235 York St
- 223 York St
- 101 W Prospect St
- 239 York St
- 221 York St
- 136 Collis St
- 140 Collis St
- 140 Collis St Unit Garage
- 140 Collis St Unit 2nd floor
- 91 W Prospect St
- 95 W Prospect St
- 87 W Prospect St
- 88 W Prospect St
- 215 York St
- 21 Oleander St