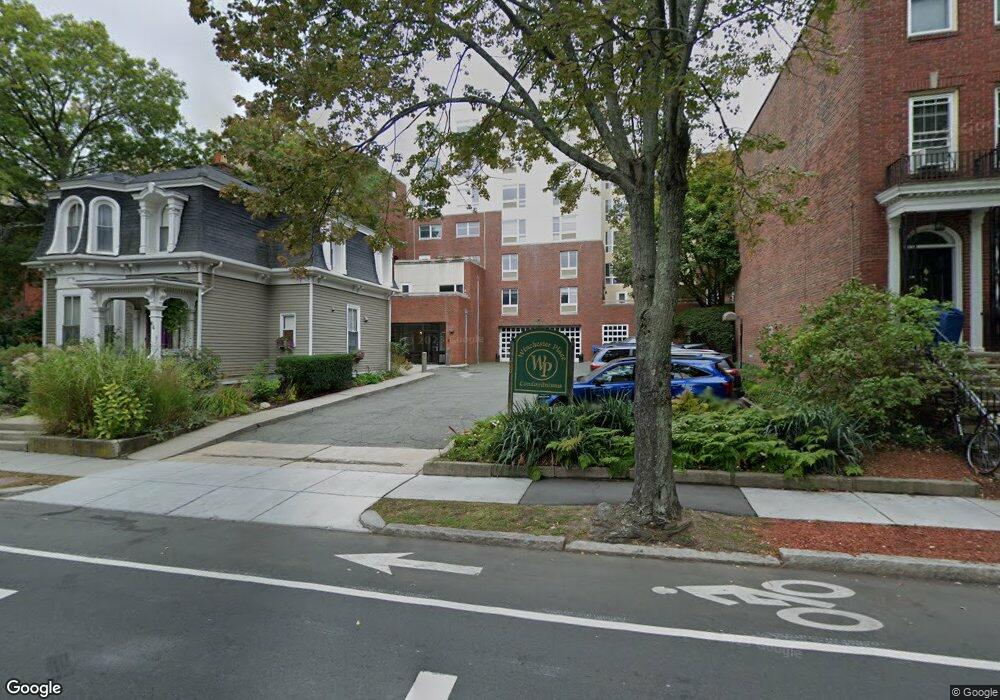
66 Winchester St Unit 402, 66 Brookline, MA 02446
Washington Square NeighborhoodEstimated Value: $1,130,000 - $1,147,000
2
Beds
2
Baths
1,198
Sq Ft
$950/Sq Ft
Est. Value
About This Home
This home is located at 66 Winchester St Unit 402, 66, Brookline, MA 02446 and is currently estimated at $1,138,438, approximately $950 per square foot. 66 Winchester St Unit 402, 66 is a home located in Norfolk County with nearby schools including Match Charter Public School and Torah Academy.
Ownership History
Date
Name
Owned For
Owner Type
Purchase Details
Closed on
Jun 1, 2010
Sold by
Shore Arnold and Sellers Laurisa
Bought by
Nakamura Eijiro and Nakamura Nobuko
Current Estimated Value
Purchase Details
Closed on
Nov 17, 2005
Sold by
Chong Cyril P and Chen Yi-Ju E
Bought by
Shore Arnold and Sellers Laurisa
Home Financials for this Owner
Home Financials are based on the most recent Mortgage that was taken out on this home.
Original Mortgage
$350,000
Interest Rate
6.07%
Mortgage Type
Purchase Money Mortgage
Purchase Details
Closed on
Jan 10, 2002
Sold by
Leung Chi C
Bought by
Chong Cyril P
Purchase Details
Closed on
Jan 8, 1999
Sold by
Azod Roxane and Azod Rokhsan
Bought by
Leung Chi C
Home Financials for this Owner
Home Financials are based on the most recent Mortgage that was taken out on this home.
Original Mortgage
$199,000
Interest Rate
6.8%
Mortgage Type
Purchase Money Mortgage
Create a Home Valuation Report for This Property
The Home Valuation Report is an in-depth analysis detailing your home's value as well as a comparison with similar homes in the area
Home Values in the Area
Average Home Value in this Area
Purchase History
| Date | Buyer | Sale Price | Title Company |
|---|---|---|---|
| Nakamura Eijiro | $600,000 | -- | |
| Shore Arnold | $520,000 | -- | |
| Chong Cyril P | $375,000 | -- | |
| Leung Chi C | $285,000 | -- |
Source: Public Records
Mortgage History
| Date | Status | Borrower | Loan Amount |
|---|---|---|---|
| Previous Owner | Leung Chi C | $337,500 | |
| Previous Owner | Shore Arnold | $350,000 | |
| Previous Owner | Shore Arnold | $140,000 | |
| Previous Owner | Leung Chi C | $199,000 |
Source: Public Records
Tax History Compared to Growth
Tax History
| Year | Tax Paid | Tax Assessment Tax Assessment Total Assessment is a certain percentage of the fair market value that is determined by local assessors to be the total taxable value of land and additions on the property. | Land | Improvement |
|---|---|---|---|---|
| 2025 | $10,256 | $1,039,100 | $0 | $1,039,100 |
| 2024 | $9,954 | $1,018,800 | $0 | $1,018,800 |
| 2023 | $9,772 | $980,100 | $0 | $980,100 |
| 2022 | $9,792 | $960,900 | $0 | $960,900 |
| 2021 | $9,325 | $951,500 | $0 | $951,500 |
| 2020 | $8,903 | $942,100 | $0 | $942,100 |
| 2019 | $8,407 | $897,200 | $0 | $897,200 |
| 2018 | $7,905 | $835,600 | $0 | $835,600 |
| 2017 | $7,644 | $773,700 | $0 | $773,700 |
| 2016 | $7,328 | $703,300 | $0 | $703,300 |
| 2015 | $6,829 | $639,400 | $0 | $639,400 |
| 2014 | $6,565 | $576,400 | $0 | $576,400 |
Source: Public Records
Map
Nearby Homes
- 138 Mason Terrace Unit 1
- 15 Short St Unit 4
- 93 Centre St Unit 2
- 19 Winchester St Unit 110
- 107 Centre St Unit A
- 188 Mason Terrace Unit 188
- 186 Mason Terrace Unit 186
- 89 Marion St
- 373 Harvard St Unit 1
- 1471 Beacon St Unit 7
- 1471 Beacon St Unit 1
- 80 Vernon St Unit 1-A
- 80 Vernon St Unit 2B
- 80 Vernon St Unit PHA
- 80 Vernon St Unit 3A
- 80 Vernon St Unit 3B
- 10 Bradford Terrace Unit 5
- 1521 Beacon St Unit 1
- 14 Green St Unit PHA
- 14 Green St Unit PH1
- 66 Winchester St Unit PHA
- 66 Winchester St Unit 503
- 66 Winchester St Unit 502
- 66 Winchester St Unit 501
- 66 Winchester St Unit 403
- 66 Winchester St Unit 402
- 66 Winchester St Unit 401
- 66 Winchester St Unit 303
- 66 Winchester St Unit 302
- 66 Winchester St Unit 301
- 66 Winchester St Unit 202
- 66 Winchester St Unit 201
- 66 Winchester St Unit 102
- 66 Winchester St Unit 101
- 66 Winchester St
- 66 Winchester St Unit 2
- 66 Winchester St Unit 303 66
- 64 Winchester St Unit 100
- 45 Atherton Rd Unit 3
- 45 Atherton Rd Unit 2