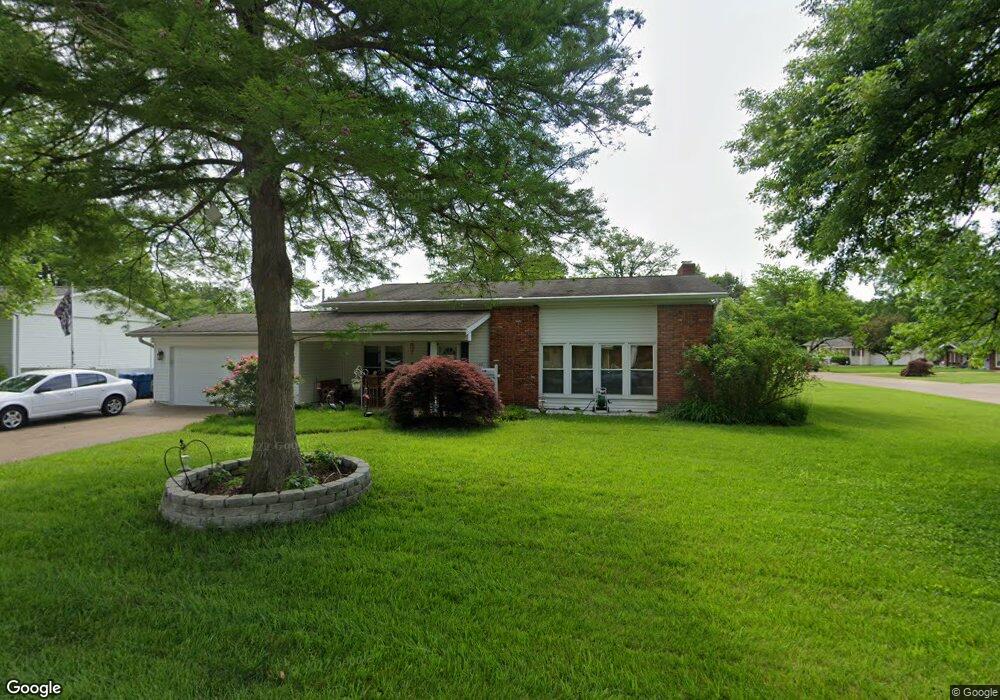
660 Carriage Ln Hazelwood, MO 63042
Estimated Value: $218,000 - $228,000
3
Beds
3
Baths
1,856
Sq Ft
$121/Sq Ft
Est. Value
About This Home
This home is located at 660 Carriage Ln, Hazelwood, MO 63042 and is currently estimated at $224,459, approximately $120 per square foot. 660 Carriage Ln is a home located in St. Louis County with nearby schools including McNair Elementary School, Northwest Middle School, and Hazelwood West High School.
Ownership History
Date
Name
Owned For
Owner Type
Purchase Details
Closed on
Jun 15, 2018
Sold by
Wojciechowski Peter M and Wojciechowski Catherine G
Bought by
Tanner Alexander G
Current Estimated Value
Home Financials for this Owner
Home Financials are based on the most recent Mortgage that was taken out on this home.
Original Mortgage
$116,800
Outstanding Balance
$85,911
Interest Rate
4.5%
Mortgage Type
New Conventional
Estimated Equity
$138,548
Purchase Details
Closed on
Jul 23, 2004
Sold by
Kopp Gregory W and Kopp Kimberly Ann
Bought by
Wojciechowski Peter M and Wojciechowski Catherine G
Home Financials for this Owner
Home Financials are based on the most recent Mortgage that was taken out on this home.
Original Mortgage
$151,400
Interest Rate
6.3%
Mortgage Type
Purchase Money Mortgage
Create a Home Valuation Report for This Property
The Home Valuation Report is an in-depth analysis detailing your home's value as well as a comparison with similar homes in the area
Home Values in the Area
Average Home Value in this Area
Purchase History
| Date | Buyer | Sale Price | Title Company |
|---|---|---|---|
| Tanner Alexander G | $146,000 | Clear Title Group | |
| Wojciechowski Peter M | $151,400 | -- |
Source: Public Records
Mortgage History
| Date | Status | Borrower | Loan Amount |
|---|---|---|---|
| Open | Tanner Alexander G | $116,800 | |
| Previous Owner | Wojciechowski Peter M | $151,400 |
Source: Public Records
Tax History Compared to Growth
Tax History
| Year | Tax Paid | Tax Assessment Tax Assessment Total Assessment is a certain percentage of the fair market value that is determined by local assessors to be the total taxable value of land and additions on the property. | Land | Improvement |
|---|---|---|---|---|
| 2025 | $2,973 | $40,140 | $8,110 | $32,030 |
| 2024 | $2,973 | $36,520 | $4,160 | $32,360 |
| 2023 | $3,012 | $36,520 | $4,160 | $32,360 |
| 2022 | $2,698 | $29,220 | $6,310 | $22,910 |
| 2021 | $2,653 | $29,220 | $6,310 | $22,910 |
| 2020 | $2,762 | $28,480 | $6,310 | $22,170 |
| 2019 | $2,699 | $28,480 | $6,310 | $22,170 |
| 2018 | $2,426 | $23,710 | $3,360 | $20,350 |
| 2017 | $2,413 | $23,710 | $3,360 | $20,350 |
| 2016 | $2,263 | $22,040 | $2,600 | $19,440 |
| 2015 | $2,211 | $22,040 | $2,600 | $19,440 |
| 2014 | $2,140 | $21,240 | $5,050 | $16,190 |
Source: Public Records
Map
Nearby Homes
- 7359 Cartwheel Ln
- 698 Carriage Ln
- 575 Candle Light Ln
- 574 Coach Light Ln
- 704 Holiday Ave
- 7525 English Coach Ln
- 753 Coach Light Ln
- 735 Teson Rd
- 7565 English Coach Ln
- 805 Coach Light Ln
- 525 Fox Crest Dr
- 506 Impala Ln
- 7435 Foxtrail Dr
- 6803 Cherryvale Dr
- 541 White Birch Way
- 523 Foxtrail Dr
- 1495 Yaqui Dr
- 1565 Yaqui Dr
- 7403 Olian Dr
- 7412 Burcke Dr
- 629 Lamplight Ln
- 670 Carriage Ln
- 663 Carriage Ln
- 7323 Cartwheel Ln
- 7347 Cartwheel Ln
- 674 Carriage Ln
- 634 Lamplight Ln
- 675 Carriage Ln
- 630 Lamplight Ln
- 700 Lamplight Ln
- 707 Lamplight Ln
- 680 Carriage Ln
- 626 Lamplight Ln
- 704 Lamplight Ln
- 687 Carriage Ln
- 7371 Cartwheel Ln
- 688 Carriage Ln
- 708 Lamplight Ln
- 711 Lamplight Ln
- 622 Lamplight Ln