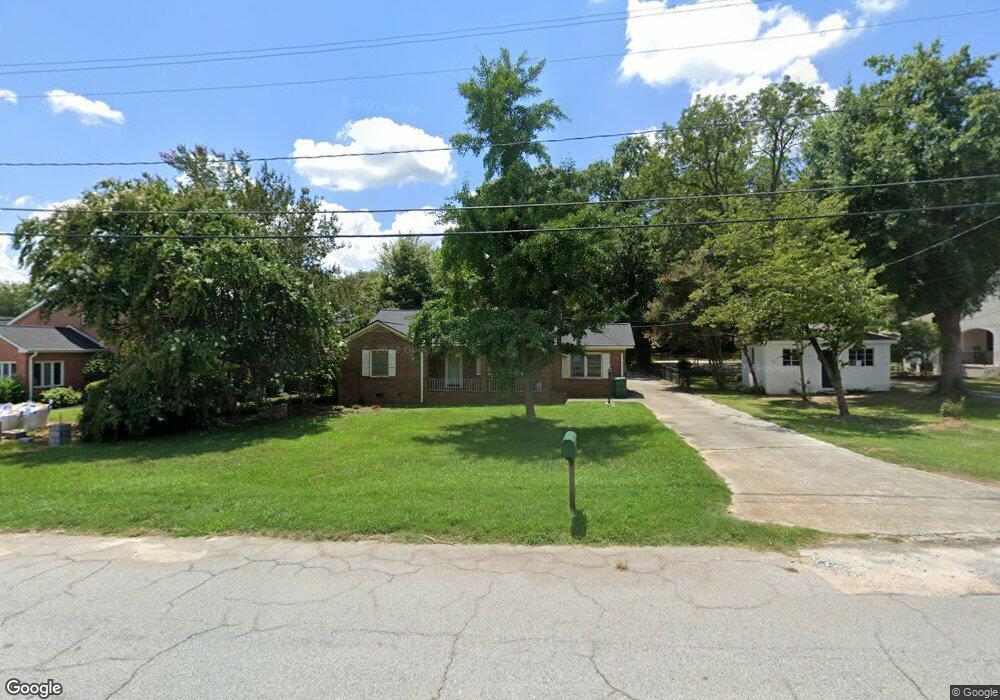
660 E Howell St Hartwell, GA 30643
Estimated Value: $256,921 - $356,000
3
Beds
2
Baths
2,188
Sq Ft
$142/Sq Ft
Est. Value
About This Home
This home is located at 660 E Howell St, Hartwell, GA 30643 and is currently estimated at $311,480, approximately $142 per square foot. 660 E Howell St is a home located in Hart County with nearby schools including Hart County High School, Barnes Academy, and Hartwell Mennonite School.
Ownership History
Date
Name
Owned For
Owner Type
Purchase Details
Closed on
Apr 30, 2008
Sold by
Chipman Linda C
Bought by
Head Alane M
Current Estimated Value
Home Financials for this Owner
Home Financials are based on the most recent Mortgage that was taken out on this home.
Original Mortgage
$155,800
Outstanding Balance
$98,564
Interest Rate
5.86%
Mortgage Type
New Conventional
Estimated Equity
$212,916
Purchase Details
Closed on
Aug 15, 2006
Sold by
Cruce Hallie W
Bought by
Chipman Linda C
Home Financials for this Owner
Home Financials are based on the most recent Mortgage that was taken out on this home.
Original Mortgage
$136,501
Interest Rate
6.73%
Mortgage Type
New Conventional
Purchase Details
Closed on
May 1, 2001
Purchase Details
Closed on
Jan 1, 1993
Purchase Details
Closed on
Apr 1, 1989
Create a Home Valuation Report for This Property
The Home Valuation Report is an in-depth analysis detailing your home's value as well as a comparison with similar homes in the area
Home Values in the Area
Average Home Value in this Area
Purchase History
| Date | Buyer | Sale Price | Title Company |
|---|---|---|---|
| Head Alane M | $164,000 | -- | |
| Chipman Linda C | $159,000 | -- | |
| -- | -- | -- | |
| -- | $89,500 | -- | |
| -- | $72,000 | -- | |
| -- | -- | -- | |
| -- | $85,000 | -- |
Source: Public Records
Mortgage History
| Date | Status | Borrower | Loan Amount |
|---|---|---|---|
| Open | Head Alane M | $155,800 | |
| Previous Owner | Chipman Linda C | $136,501 |
Source: Public Records
Tax History Compared to Growth
Tax History
| Year | Tax Paid | Tax Assessment Tax Assessment Total Assessment is a certain percentage of the fair market value that is determined by local assessors to be the total taxable value of land and additions on the property. | Land | Improvement |
|---|---|---|---|---|
| 2024 | $2,150 | $89,024 | $12,000 | $77,024 |
| 2023 | $2,043 | $78,841 | $12,000 | $66,841 |
| 2022 | $1,063 | $63,836 | $12,000 | $51,836 |
| 2021 | $1,081 | $58,260 | $12,000 | $46,260 |
| 2020 | $1,091 | $56,322 | $12,000 | $44,322 |
| 2019 | $1,062 | $54,349 | $12,000 | $42,349 |
| 2018 | $1,102 | $55,726 | $12,000 | $43,726 |
| 2017 | $1,098 | $55,222 | $12,000 | $43,222 |
| 2016 | $1,056 | $51,476 | $12,000 | $39,476 |
| 2015 | $1,002 | $51,438 | $12,000 | $39,438 |
| 2014 | $997 | $50,182 | $12,000 | $38,182 |
| 2013 | -- | $57,178 | $12,000 | $45,178 |
Source: Public Records
Map
Nearby Homes
- 66 Cleveland Ave
- 163 Cleveland Ave
- 29 Highway 29
- 2 2nd St
- 76 Campbell Dr
- 113 Maple St Unit 3 HOMES
- 123 Fairview Station
- 8A Forest Creek Cir
- 34 Depot Unit 22 St
- 34 Depot Unit 25 St
- 34 Depot Unit 23 St
- 34 Depot Unit 21 St
- 34 Depot Unit 24 St
- 34 Depot St Unit 25
- 34 Depot St Unit 21
- 34 Depot St Unit 22
- 34 Depot St Unit 23
- 34 Depot St Unit 24
- 470 Benson St
- 218 Savannah St
- 36 Somerset Ct Unit 4
- 36 Somerset Ct
- 24 Somerset Ct
- 38 Somerset Ct Unit 5
- 18 Somerset Ct
- 18 Somerset Ct Unit 1
- 46 Somerset Ct
- 31 Somerset Ct
- 41 Somerset Ct
- 620 E Howell St
- 11 Somerset Ct
- 0 Driftwood Ln Unit 9 8503566
- 0 Driftwood Ln Unit 8B 8503564
- 0 Driftwood Ln Unit 8A 8503562
- 61 First St
- 68 Somerset Ct
- 8 Compton Ct
- 647 E Howell St
- 70 Somerset Ct
- 606 E Howell St