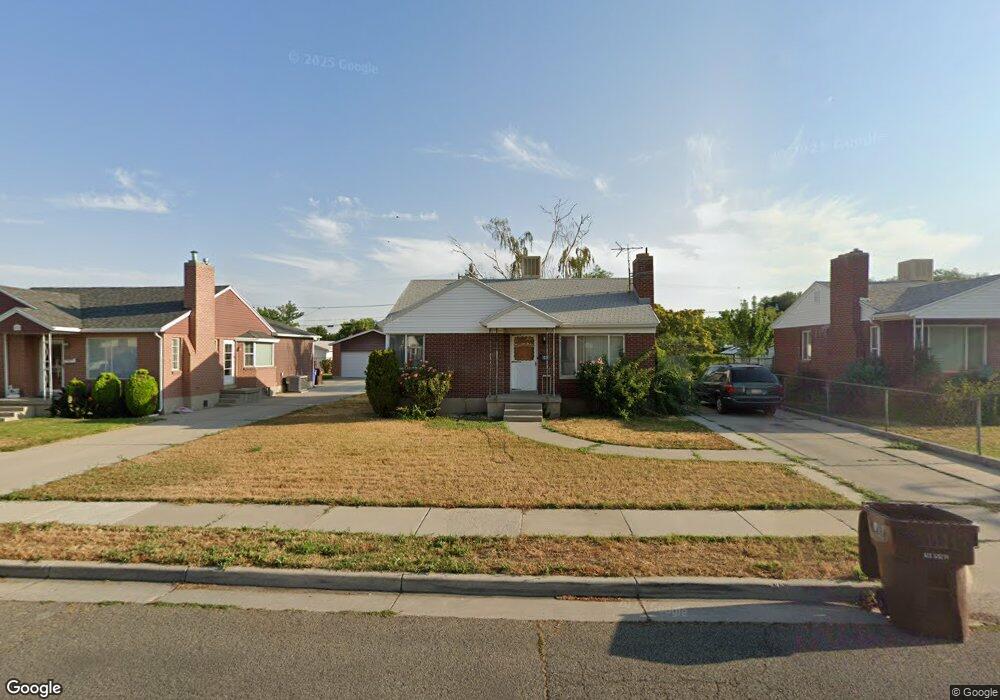
660 Fern Dr Midvale, UT 84047
Estimated Value: $399,000 - $430,000
3
Beds
1
Bath
848
Sq Ft
$487/Sq Ft
Est. Value
About This Home
This home is located at 660 Fern Dr, Midvale, UT 84047 and is currently estimated at $413,015, approximately $487 per square foot. 660 Fern Dr is a home located in Salt Lake County with nearby schools including Midvale Elementary School, Midvale Middle School, and Hillcrest High School.
Ownership History
Date
Name
Owned For
Owner Type
Purchase Details
Closed on
Jul 28, 1997
Sold by
Jensen Delan and Juretich Delan J
Bought by
Jensen Delan
Current Estimated Value
Home Financials for this Owner
Home Financials are based on the most recent Mortgage that was taken out on this home.
Original Mortgage
$30,000
Interest Rate
7.58%
Purchase Details
Closed on
Jul 11, 1997
Sold by
Olsen Hans
Bought by
Jensen Delan
Home Financials for this Owner
Home Financials are based on the most recent Mortgage that was taken out on this home.
Original Mortgage
$30,000
Interest Rate
7.58%
Purchase Details
Closed on
Jul 10, 1997
Sold by
Poulsen Ernest K
Bought by
Jensen Delan
Home Financials for this Owner
Home Financials are based on the most recent Mortgage that was taken out on this home.
Original Mortgage
$30,000
Interest Rate
7.58%
Create a Home Valuation Report for This Property
The Home Valuation Report is an in-depth analysis detailing your home's value as well as a comparison with similar homes in the area
Home Values in the Area
Average Home Value in this Area
Purchase History
| Date | Buyer | Sale Price | Title Company |
|---|---|---|---|
| Jensen Delan | -- | -- | |
| Jensen Delan | -- | -- | |
| Jensen Delan | -- | -- |
Source: Public Records
Mortgage History
| Date | Status | Borrower | Loan Amount |
|---|---|---|---|
| Closed | Jensen Delan | $30,000 |
Source: Public Records
Tax History
| Year | Tax Paid | Tax Assessment Tax Assessment Total Assessment is a certain percentage of the fair market value that is determined by local assessors to be the total taxable value of land and additions on the property. | Land | Improvement |
|---|---|---|---|---|
| 2025 | $2,050 | $364,100 | $134,700 | $229,400 |
| 2024 | $2,050 | $349,600 | $127,500 | $222,100 |
| 2023 | $2,002 | $339,100 | $121,200 | $217,900 |
| 2022 | $2,103 | $347,800 | $118,800 | $229,000 |
| 2021 | $1,935 | $274,600 | $108,900 | $165,700 |
| 2020 | $1,641 | $220,700 | $79,200 | $141,500 |
| 2019 | $1,513 | $198,600 | $74,300 | $124,300 |
| 2016 | $1,472 | $183,600 | $74,300 | $109,300 |
Source: Public Records
Map
Nearby Homes
- 652 W Gardenia Dr
- 7923 S Main St Unit 23
- 7852 Holden St
- 775 Lennox St
- 718 W Blue Magic Ln Unit S203
- 718 W Blue Magic Ln Unit S201
- 736 W Blue Magic Ln Unit R303
- 736 W Blue Magic Ln Unit R204
- 736 W Blue Magic Ln Unit R203
- 396 Harvard Dr
- 8362 S Iris Lumi Ln Unit P303
- 8362 S Iris Lumi Ln Unit P303
- 8392 Sky Mirror Ln Unit 204
- 332 W Harvard Dr
- 311 Marquette Dr
- 8332 S Hayes St
- 7689 Locust St
- 620 W 2nd Ave
- 857 W Shelton Way
- 636 W 4th Ave
Your Personal Tour Guide
Ask me questions while you tour the home.