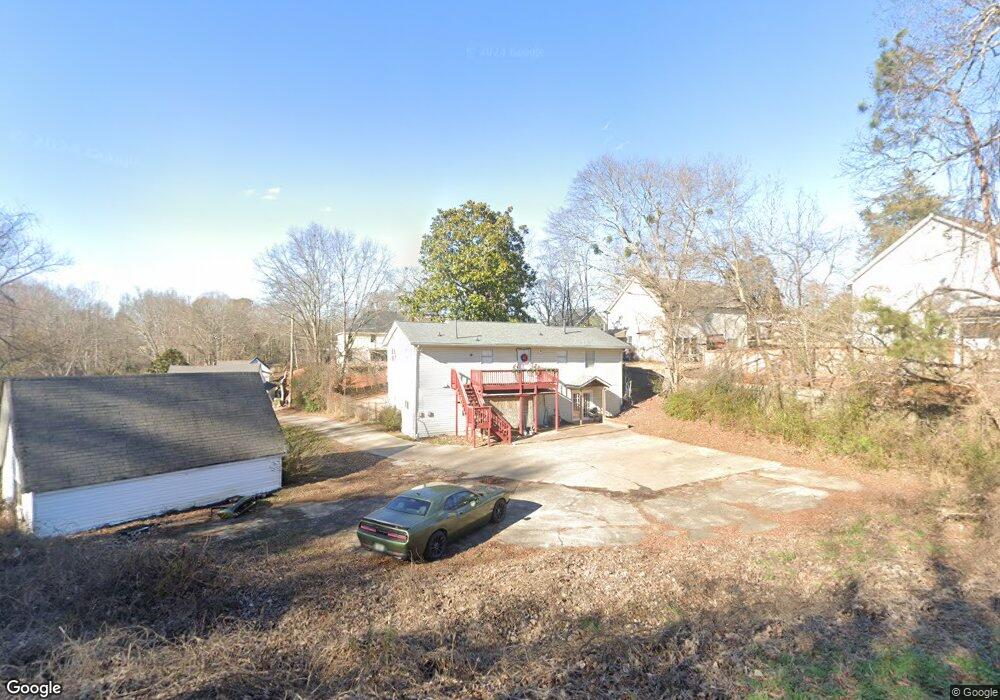
660 George St Buford, GA 30518
Estimated Value: $451,000 - $662,000
3
Beds
2
Baths
1,152
Sq Ft
$461/Sq Ft
Est. Value
About This Home
This home is located at 660 George St, Buford, GA 30518 and is currently estimated at $531,321, approximately $461 per square foot. 660 George St is a home located in Gwinnett County with nearby schools including Buford Elementary School, Buford Senior Academy, and Buford Academy.
Ownership History
Date
Name
Owned For
Owner Type
Purchase Details
Closed on
Mar 1, 2012
Sold by
Mason Susie
Bought by
Sdm Georgia I Family Trust
Current Estimated Value
Purchase Details
Closed on
Apr 4, 1997
Sold by
Pass Gregory L and Pass Kathy
Bought by
Padgett Susie D
Home Financials for this Owner
Home Financials are based on the most recent Mortgage that was taken out on this home.
Original Mortgage
$65,100
Interest Rate
7.86%
Mortgage Type
New Conventional
Create a Home Valuation Report for This Property
The Home Valuation Report is an in-depth analysis detailing your home's value as well as a comparison with similar homes in the area
Home Values in the Area
Average Home Value in this Area
Purchase History
| Date | Buyer | Sale Price | Title Company |
|---|---|---|---|
| Sdm Georgia I Family Trust | -- | -- | |
| Padgett Susie D | $86,900 | -- |
Source: Public Records
Mortgage History
| Date | Status | Borrower | Loan Amount |
|---|---|---|---|
| Previous Owner | Padgett Susie D | $65,100 |
Source: Public Records
Tax History Compared to Growth
Tax History
| Year | Tax Paid | Tax Assessment Tax Assessment Total Assessment is a certain percentage of the fair market value that is determined by local assessors to be the total taxable value of land and additions on the property. | Land | Improvement |
|---|---|---|---|---|
| 2025 | $2,181 | $151,960 | $40,000 | $111,960 |
| 2024 | $2,203 | $153,520 | $33,600 | $119,920 |
| 2023 | $2,203 | $115,120 | $26,000 | $89,120 |
| 2022 | $1,652 | $115,120 | $26,000 | $89,120 |
| 2021 | $1,041 | $72,560 | $16,800 | $55,760 |
| 2020 | $1,041 | $72,560 | $16,800 | $55,760 |
| 2019 | $549 | $72,560 | $16,800 | $55,760 |
| 2018 | $549 | $42,360 | $5,600 | $36,760 |
| 2016 | $543 | $42,360 | $5,600 | $36,760 |
| 2015 | $562 | $42,360 | $5,600 | $36,760 |
| 2014 | $536 | $39,760 | $5,600 | $34,160 |
Source: Public Records
Map
Nearby Homes
- 630 George St
- 665 George St
- 665 W Shadburn Ave
- 645 W Shadburn Ave
- 675 W Shadburn Ave
- 39 Poplar St
- 625 W Shadburn Ave
- 650 Jackson St
- 631 George St
- 406 S Jones St
- 609 Garner St
- 19 Poplar St
- 685 George St
- 670 Jackson St
- 640 Jackson St
- 7 Poplar St
- 89 Poplar St
- 623 George St
- W Jackson St
- W W Shadburn Ave