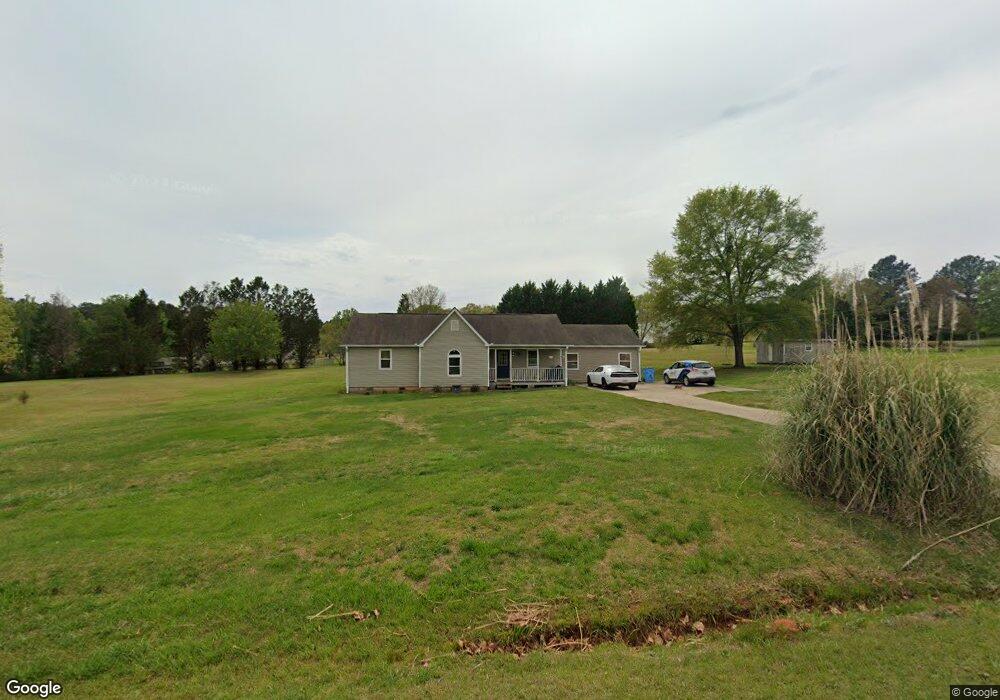
660 Laney Rd Locust Grove, GA 30248
Estimated Value: $246,939 - $279,000
3
Beds
2
Baths
1,291
Sq Ft
$203/Sq Ft
Est. Value
About This Home
This home is located at 660 Laney Rd, Locust Grove, GA 30248 and is currently estimated at $262,485, approximately $203 per square foot. 660 Laney Rd is a home located in Henry County with nearby schools including New Hope Elementary School, Locust Grove Middle School, and Locust Grove High School.
Ownership History
Date
Name
Owned For
Owner Type
Purchase Details
Closed on
Aug 27, 2017
Sold by
Willcutt Keith A
Bought by
Willcutt Keith A and Willcutt Brandy
Current Estimated Value
Home Financials for this Owner
Home Financials are based on the most recent Mortgage that was taken out on this home.
Original Mortgage
$83,500
Outstanding Balance
$44,442
Interest Rate
3.82%
Mortgage Type
New Conventional
Estimated Equity
$218,043
Purchase Details
Closed on
Feb 28, 2002
Sold by
Smith Angela M
Bought by
Willcutt Keith A
Home Financials for this Owner
Home Financials are based on the most recent Mortgage that was taken out on this home.
Original Mortgage
$107,539
Interest Rate
6.89%
Mortgage Type
FHA
Purchase Details
Closed on
Nov 15, 1993
Sold by
Gintoli Jeffrey J
Bought by
Smith Angela M
Home Financials for this Owner
Home Financials are based on the most recent Mortgage that was taken out on this home.
Original Mortgage
$67,224
Interest Rate
6.75%
Create a Home Valuation Report for This Property
The Home Valuation Report is an in-depth analysis detailing your home's value as well as a comparison with similar homes in the area
Home Values in the Area
Average Home Value in this Area
Purchase History
| Date | Buyer | Sale Price | Title Company |
|---|---|---|---|
| Willcutt Keith A | -- | -- | |
| Willcutt Keith A | $108,400 | -- | |
| Smith Angela M | $66,700 | -- |
Source: Public Records
Mortgage History
| Date | Status | Borrower | Loan Amount |
|---|---|---|---|
| Open | Willcutt Keith A | $83,500 | |
| Previous Owner | Willcutt Keith A | $107,539 | |
| Previous Owner | Smith Angela M | $67,224 |
Source: Public Records
Tax History Compared to Growth
Tax History
| Year | Tax Paid | Tax Assessment Tax Assessment Total Assessment is a certain percentage of the fair market value that is determined by local assessors to be the total taxable value of land and additions on the property. | Land | Improvement |
|---|---|---|---|---|
| 2025 | $2,539 | $95,440 | $14,000 | $81,440 |
| 2024 | $2,539 | $94,560 | $14,000 | $80,560 |
| 2023 | $2,123 | $94,480 | $14,000 | $80,480 |
| 2022 | $2,330 | $81,840 | $14,000 | $67,840 |
| 2021 | $1,889 | $63,160 | $14,000 | $49,160 |
| 2020 | $1,651 | $53,080 | $12,000 | $41,080 |
| 2019 | $1,646 | $52,840 | $12,000 | $40,840 |
| 2018 | $1,499 | $46,640 | $10,800 | $35,840 |
| 2016 | $1,447 | $44,400 | $10,000 | $34,400 |
| 2015 | $1,204 | $36,720 | $8,000 | $28,720 |
| 2014 | $1,061 | $32,880 | $8,000 | $24,880 |
Source: Public Records
Map
Nearby Homes
- 690 Laney Rd
- S S Laney Rd
- 376 Cattlemans Cir
- 976 S Laney Rd
- 888 Laney Rd
- 328 Cattlemans Cir
- 125 Karen Dr
- 121 Ducati Dr
- 0 S Ola Rd Unit 10563258
- 125 Laney Ct
- 813 S Ola Rd
- 175 Laney Ct Unit 1
- 732 New Hope Rd
- 215 Laney Rd
- 100 Harbin Trail
- 225 Laney Ct
- 1126 Old Jackson Rd
- 290 New Hope Rd
- 995 Old Jackson Rd
- 143 Whitworth Dr Unit 10
- 650 Laney Rd
- 670 Laney Rd
- 117 Cedar Ridge Rd
- 113 Cedar Ridge Rd
- 121 Cedar Ridge Rd
- 583 Laney Rd
- 575 Laney Rd
- 591 Laney Rd
- 680 Laney Rd
- 640 Laney Rd
- 125 Cedar Ridge Rd Unit 1
- 567 Laney Rd
- 109 Cedar Ridge Rd
- 599 Laney Rd
- 112 Cedar Ridge Rd
- 559 Laney Rd
- 129 Cedar Ridge Rd
- 108 Cedar Ridge Rd
- 620 Laney Rd
- 120 Cedar Ridge Rd