Estimated Value: $201,000 - $262,000
3
Beds
3
Baths
1,680
Sq Ft
$143/Sq Ft
Est. Value
About This Home
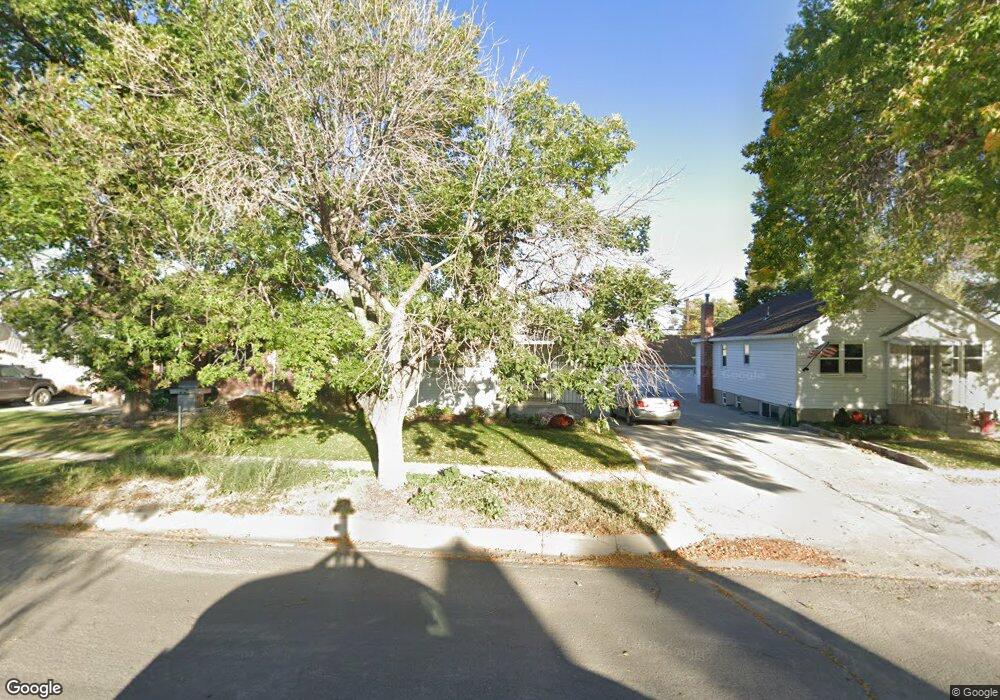
This home is located at 660 N 200 E, Price, UT 84501 and is currently estimated at $239,700, approximately $142 per square foot. 660 N 200 E is a home located in Carbon County with nearby schools including Castle Heights School, Mont Harmon Junior High School, and Carbon High School.
Ownership History
Date
Name
Owned For
Owner Type
Purchase Details
Closed on
Aug 2, 2019
Sold by
Dayton Daniel and Dayton Rhett
Bought by
Anson Ellen E
Current Estimated Value
Purchase Details
Closed on
Nov 21, 2018
Sold by
Schade Ralph V and New Line Mortgage
Bought by
Dayton Daniel and Dayton Rhett
Purchase Details
Closed on
Sep 11, 2009
Sold by
Schade Ralph V
Bought by
Schade Ralpa V and Tucker Jensen Carrol Deann
Home Financials for this Owner
Home Financials are based on the most recent Mortgage that was taken out on this home.
Original Mortgage
$90,811
Interest Rate
5.18%
Mortgage Type
FHA
Purchase Details
Closed on
Mar 23, 2005
Sold by
Schade Ralph V
Bought by
Schade Ralph V and Jensen Carrol Deann Tucker
Home Financials for this Owner
Home Financials are based on the most recent Mortgage that was taken out on this home.
Original Mortgage
$75,822
Interest Rate
5.53%
Mortgage Type
FHA
Create a Home Valuation Report for This Property
The Home Valuation Report is an in-depth analysis detailing your home's value as well as a comparison with similar homes in the area
Purchase History
| Date | Buyer | Sale Price | Title Company |
|---|---|---|---|
| Anson Ellen E | -- | Professional Title Services | |
| Dayton Daniel | $45,500 | None Available | |
| Schade Ralpa V | -- | Inwest Title Services Inc | |
| Schade Ralph V | -- | Inwest Title Services Inc | |
| Schade Ralph V | -- | Professional Title Services | |
| Schade Ralph V | -- | Professional Title Services |
Source: Public Records
Mortgage History
| Date | Status | Borrower | Loan Amount |
|---|---|---|---|
| Previous Owner | Schade Ralph V | $90,811 | |
| Previous Owner | Schade Ralph V | $75,822 |
Source: Public Records
Tax History
| Year | Tax Paid | Tax Assessment Tax Assessment Total Assessment is a certain percentage of the fair market value that is determined by local assessors to be the total taxable value of land and additions on the property. | Land | Improvement |
|---|---|---|---|---|
| 2025 | $715 | $58,851 | $11,590 | $47,261 |
| 2024 | $1,004 | $83,608 | $11,550 | $72,058 |
| 2023 | $1,144 | $101,622 | $12,647 | $88,975 |
| 2022 | $1,191 | $94,847 | $10,514 | $84,333 |
| 2021 | $1,029 | $127,175 | $16,065 | $111,110 |
| 2020 | $1,011 | $62,715 | $0 | $0 |
| 2019 | $810 | $52,678 | $0 | $0 |
| 2018 | $774 | $51,367 | $0 | $0 |
| 2017 | $764 | $51,367 | $0 | $0 |
| 2016 | $690 | $51,367 | $0 | $0 |
| 2015 | $690 | $51,367 | $0 | $0 |
| 2014 | $685 | $51,367 | $0 | $0 |
| 2013 | $734 | $54,518 | $0 | $0 |
Source: Public Records
Map
Nearby Homes
Your Personal Tour Guide
Ask me questions while you tour the home.