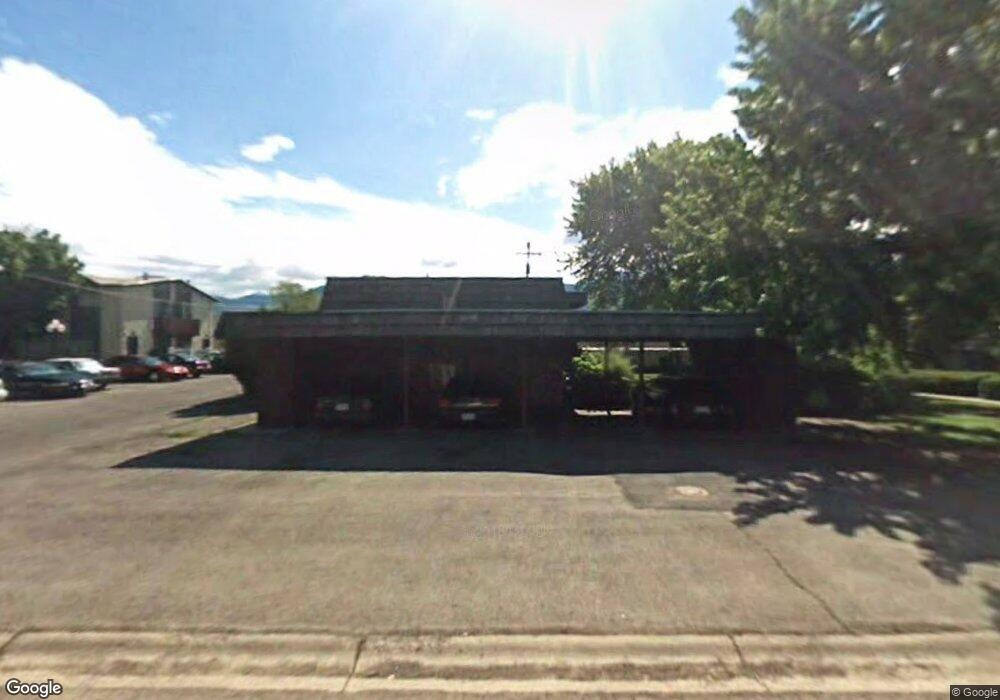
660 N 80 W Logan, UT 84321
Bridger NeighborhoodEstimated Value: $731,000 - $2,035,000
8
Beds
4
Baths
3,600
Sq Ft
$341/Sq Ft
Est. Value
About This Home
This home is located at 660 N 80 W, Logan, UT 84321 and is currently estimated at $1,226,333, approximately $340 per square foot. 660 N 80 W is a home located in Cache County with nearby schools including Bridger School, Mount Logan Middle School, and Logan High School.
Ownership History
Date
Name
Owned For
Owner Type
Purchase Details
Closed on
Oct 24, 2024
Sold by
Garner Jimmie Douglas
Bought by
80 W Apts Llc
Current Estimated Value
Home Financials for this Owner
Home Financials are based on the most recent Mortgage that was taken out on this home.
Original Mortgage
$448,000
Outstanding Balance
$441,186
Interest Rate
6.09%
Mortgage Type
New Conventional
Estimated Equity
$785,147
Purchase Details
Closed on
Feb 24, 2015
Sold by
Metzger William Sidney and Metzger Karen G
Bought by
Garner James
Purchase Details
Closed on
Sep 22, 2005
Sold by
Nielson Gregory S and Nielson Vicki S
Bought by
Mentzer William Sidney and Metzger Karen G
Home Financials for this Owner
Home Financials are based on the most recent Mortgage that was taken out on this home.
Original Mortgage
$216,000
Interest Rate
5.72%
Mortgage Type
New Conventional
Create a Home Valuation Report for This Property
The Home Valuation Report is an in-depth analysis detailing your home's value as well as a comparison with similar homes in the area
Home Values in the Area
Average Home Value in this Area
Purchase History
| Date | Buyer | Sale Price | Title Company |
|---|---|---|---|
| 80 W Apts Llc | -- | Gt Title Services | |
| Garner James | -- | Hickman Land Title Company | |
| Mentzer William Sidney | -- | Hickman Land Title Company |
Source: Public Records
Mortgage History
| Date | Status | Borrower | Loan Amount |
|---|---|---|---|
| Open | 80 W Apts Llc | $448,000 | |
| Previous Owner | Mentzer William Sidney | $216,000 |
Source: Public Records
Tax History
| Year | Tax Paid | Tax Assessment Tax Assessment Total Assessment is a certain percentage of the fair market value that is determined by local assessors to be the total taxable value of land and additions on the property. | Land | Improvement |
|---|---|---|---|---|
| 2025 | $2,943 | $692,080 | $219,300 | $472,780 |
| 2024 | $3,039 | $692,080 | $219,300 | $472,780 |
| 2023 | $3,168 | $687,780 | $215,000 | $472,780 |
| 2022 | $2,985 | $605,180 | $132,400 | $472,780 |
| 2021 | $3,264 | $562,200 | $132,400 | $429,800 |
| 2020 | $2,317 | $359,200 | $90,000 | $269,200 |
| 2019 | $2,422 | $359,200 | $90,000 | $269,200 |
| 2018 | $2,146 | $290,640 | $70,000 | $220,640 |
| 2017 | $2,013 | $144,100 | $0 | $0 |
| 2016 | $2,087 | $144,100 | $0 | $0 |
| 2015 | $2,089 | $144,100 | $0 | $0 |
| 2014 | $1,888 | $144,100 | $0 | $0 |
| 2013 | -- | $135,485 | $0 | $0 |
Source: Public Records
Map
Nearby Homes
Your Personal Tour Guide
Ask me questions while you tour the home.