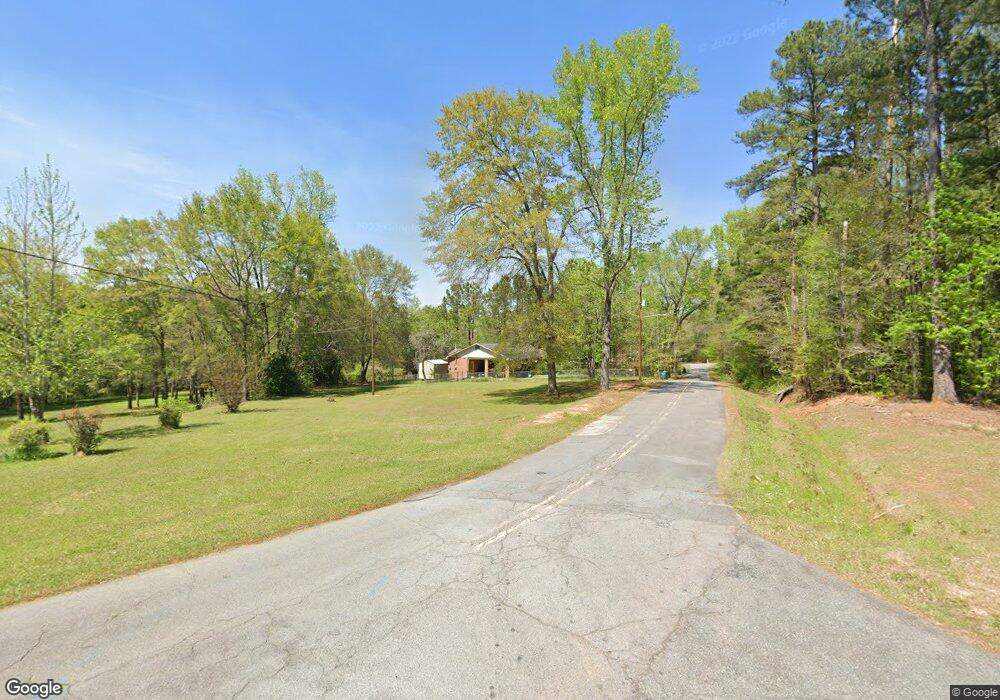
660 Nelson Rd Milledgeville, GA 31061
Estimated Value: $103,000 - $113,000
3
Beds
2
Baths
1,403
Sq Ft
$77/Sq Ft
Est. Value
About This Home
This home is located at 660 Nelson Rd, Milledgeville, GA 31061 and is currently estimated at $107,980, approximately $76 per square foot. 660 Nelson Rd is a home located in Baldwin County with nearby schools including Lakeview Primary, Lakeview Academy, and Oak Hill Middle School.
Ownership History
Date
Name
Owned For
Owner Type
Purchase Details
Closed on
Jul 30, 2019
Sold by
Young Anna Marie
Bought by
Oneal James Marshall
Current Estimated Value
Purchase Details
Closed on
Jul 28, 2015
Sold by
Wright James A
Bought by
Young Anna Marie and Young Patrick Allen
Home Financials for this Owner
Home Financials are based on the most recent Mortgage that was taken out on this home.
Original Mortgage
$55,000
Interest Rate
4.11%
Mortgage Type
New Conventional
Purchase Details
Closed on
Aug 2, 2013
Sold by
Alexander Anita Proctor
Bought by
Wright James A and Wright Mary A
Purchase Details
Closed on
Jun 22, 2006
Sold by
Alexander Anita Proctor
Bought by
Alexander Anita Proctor
Purchase Details
Closed on
Sep 14, 2005
Sold by
Procter Leroy J and Procter Jeanette N
Bought by
Procter Leroy J
Purchase Details
Closed on
Dec 1, 1966
Bought by
Proctor Leroy J and Proctor Jeanette N
Create a Home Valuation Report for This Property
The Home Valuation Report is an in-depth analysis detailing your home's value as well as a comparison with similar homes in the area
Home Values in the Area
Average Home Value in this Area
Purchase History
| Date | Buyer | Sale Price | Title Company |
|---|---|---|---|
| Oneal James Marshall | $30,000 | -- | |
| Young Anna Marie | $55,000 | -- | |
| Wright James A | $50,000 | -- | |
| Alexander Anita Proctor | -- | -- | |
| Procter Leroy J | -- | -- | |
| Proctor Leroy J | -- | -- |
Source: Public Records
Mortgage History
| Date | Status | Borrower | Loan Amount |
|---|---|---|---|
| Previous Owner | Young Anna Marie | $55,000 |
Source: Public Records
Tax History Compared to Growth
Tax History
| Year | Tax Paid | Tax Assessment Tax Assessment Total Assessment is a certain percentage of the fair market value that is determined by local assessors to be the total taxable value of land and additions on the property. | Land | Improvement |
|---|---|---|---|---|
| 2025 | $1,000 | $28,068 | $988 | $27,080 |
| 2024 | $1,000 | $28,068 | $988 | $27,080 |
| 2023 | $761 | $21,356 | $824 | $20,532 |
| 2022 | $552 | $21,620 | $824 | $20,796 |
| 2021 | $604 | $22,440 | $800 | $21,640 |
| 2020 | $330 | $12,000 | $400 | $11,600 |
| 2019 | $342 | $22,440 | $800 | $21,640 |
| 2018 | $349 | $22,440 | $800 | $21,640 |
| 2017 | $317 | $22,440 | $800 | $21,640 |
| 2016 | $259 | $19,640 | $1,960 | $17,680 |
| 2015 | $530 | $19,640 | $1,960 | $17,680 |
| 2014 | $530 | $19,640 | $1,960 | $17,680 |
Source: Public Records
Map
Nearby Homes
- 120 Caraker Ave
- 1000 Vinson & 1070 S Jefferson
- 100 Oak Ave
- 144 Bell Ave SE
- 120 E Screven St
- 130 Scott Hill St SE
- 109 Hollingshed Ave SE
- 1589 Irwinton Rd
- 179 Park Ave
- 150 Oak Dr
- 130 N Main St SW
- 151 W Washington St
- 111 Lockwood St SW
- 111 S Elbert St
- LOT 23 O'Quinns Farm Rd
- 341 S Clarke St
- 190 Youngblood Rd SE
- 341 S Clark St
- 210 C N Main St SW
- 123 Lee Dr SE
- 510 Cline Ave
- 475 Underwood Rd
- 699 Nelson Rd NW
- 410 Cline Ave
- 511 Cline Ave
- 408 Cline Ave
- 451 Cline Ave
- 1230 Perry Dr
- 1110 S Warren St
- 1220 Twin Pine Rd
- 449 Cline Ave
- 1100 S Warren St
- 1120 S Warren St
- 490 Underwood Rd
- 711 Nelson Rd
- 445 Cline Ave
- 470 Underwood Rd
- 480 Underwood Rd
- 1230 Twin Pine Rd
- 1221 Twin Pine Rd