Estimated Value: $401,000 - $629,000
--
Bed
--
Bath
2,921
Sq Ft
$180/Sq Ft
Est. Value
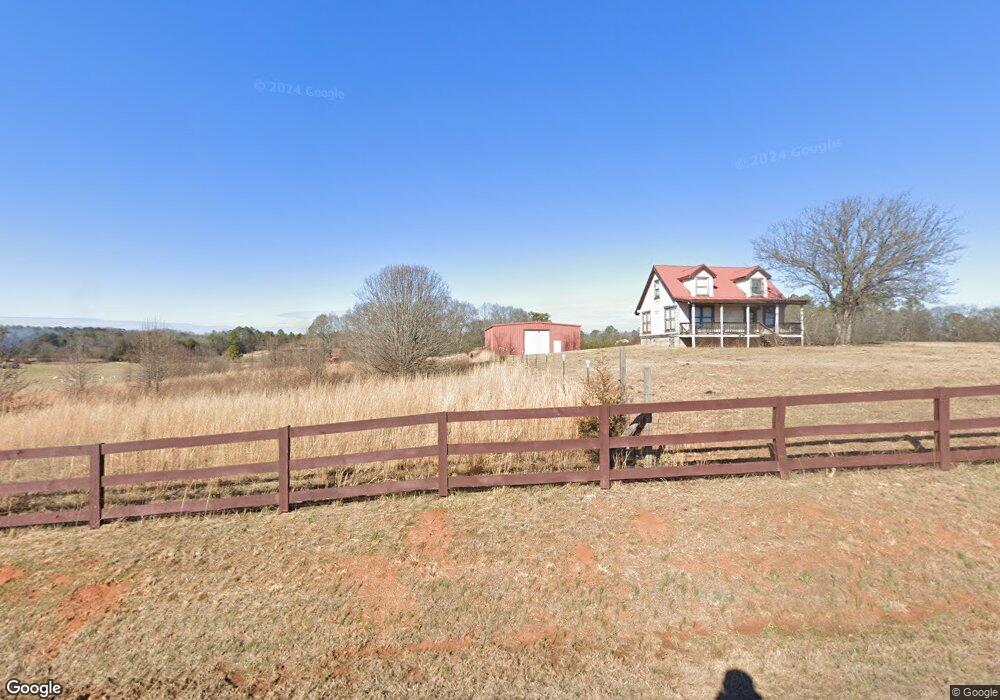
About This Home
This home is located at 660 Reynolds Bend Rd SE, Rome, GA 30161 and is currently estimated at $526,105, approximately $180 per square foot. 660 Reynolds Bend Rd SE is a home located in Floyd County with nearby schools including Model Middle School and Model High School.
Ownership History
Date
Name
Owned For
Owner Type
Purchase Details
Closed on
Oct 28, 2015
Sold by
Manna Lynne Reilly
Bought by
Manna Robert Jeffrey
Current Estimated Value
Purchase Details
Closed on
Aug 28, 2007
Sold by
Not Provided
Bought by
Manna Lynne and Manna Robert J
Purchase Details
Closed on
Mar 9, 2007
Bought by
P and R
Purchase Details
Closed on
Apr 1, 2004
Sold by
Kernes Laura B and Kernes William A
Bought by
Manna Robert J
Purchase Details
Closed on
Jul 22, 1993
Bought by
P and R
Create a Home Valuation Report for This Property
The Home Valuation Report is an in-depth analysis detailing your home's value as well as a comparison with similar homes in the area
Home Values in the Area
Average Home Value in this Area
Purchase History
| Date | Buyer | Sale Price | Title Company |
|---|---|---|---|
| Manna Robert Jeffrey | -- | -- | |
| Manna Lynne | -- | -- | |
| P | $80,500 | -- | |
| Manna Robert J | $415,000 | -- | |
| P | $4,500 | -- | |
| Kernes Laura B | $3,000 | -- |
Source: Public Records
Tax History Compared to Growth
Tax History
| Year | Tax Paid | Tax Assessment Tax Assessment Total Assessment is a certain percentage of the fair market value that is determined by local assessors to be the total taxable value of land and additions on the property. | Land | Improvement |
|---|---|---|---|---|
| 2024 | $4,851 | $235,740 | $30,898 | $204,842 |
| 2023 | $4,793 | $227,358 | $28,090 | $199,268 |
| 2022 | $3,778 | $171,095 | $23,238 | $147,857 |
| 2021 | $3,432 | $151,711 | $21,027 | $130,684 |
| 2020 | $3,995 | $143,708 | $18,284 | $125,424 |
| 2019 | $3,850 | $138,268 | $18,284 | $119,984 |
| 2018 | $3,774 | $133,087 | $17,414 | $115,673 |
| 2017 | $3,699 | $128,880 | $16,124 | $112,756 |
| 2016 | $3,351 | $112,996 | $16,120 | $96,876 |
| 2015 | $3,279 | $112,996 | $16,120 | $96,876 |
| 2014 | $3,279 | $112,996 | $16,120 | $96,876 |
Source: Public Records
Map
Nearby Homes
- 12 Winterberry Ln SE
- 127 Branson Rd SE
- 7 Trimble Way SE
- 139 Shoals Ferry Rd SE
- 0 Mountain Creek Dr SE Unit 10436191
- 158 Sproull Rd SE
- 30 Mountain Creek Dr SE
- 1849 Morrison Camp Ground Rd NE
- 291 Youngs Mill Rd
- 11 Parkwood Dr NE
- 1 Outpost Trail SE
- 16 Fallen Branch Cir SE
- 0 Fallen Branch Cir SE Unit 7397536
- 0 Fallen Branch Cir SE Unit 10311756
- 0 Fallen Branch Cir SE Unit 7234792
- 0 Fallen Branch Cir SE Unit 10172755
- 3 Outpost Trail SE
- 370 Youngs Mill Rd
- 21 Everwood Ct SE
- 96 Collins Rd NE
- 575 Reynolds Bend Rd SE
- 573 Reynolds Bend Rd SE
- 480 Reynolds Bend Rd SE
- 644 Reynolds Bend Rd SE
- 446 Reynolds Bend Rd SE
- 374 Reynolds Bend Rd SE
- 339 Reynolds Bend Rd SE
- 339 Reynolds Bend Rd SE Unit 30
- 695 Reynolds Bend Rd SE
- 625 Reynolds Bend Rd SE
- 360 Reynolds Bend Rd SE
- 744 Reynolds Bend Rd SE
- 380 Reynolds Bend Rd SE
- 400 Reynolds Bend Rd SE
- 346 Reynolds Bend Rd SE
- 312 Reynolds Bend Rd SE
- 312 Reynolds Bend Rd SE
- 719 Reynolds Bend Rd SE
- 765 Reynolds Bend Rd SE
- 800 Renyolds Bend Rd