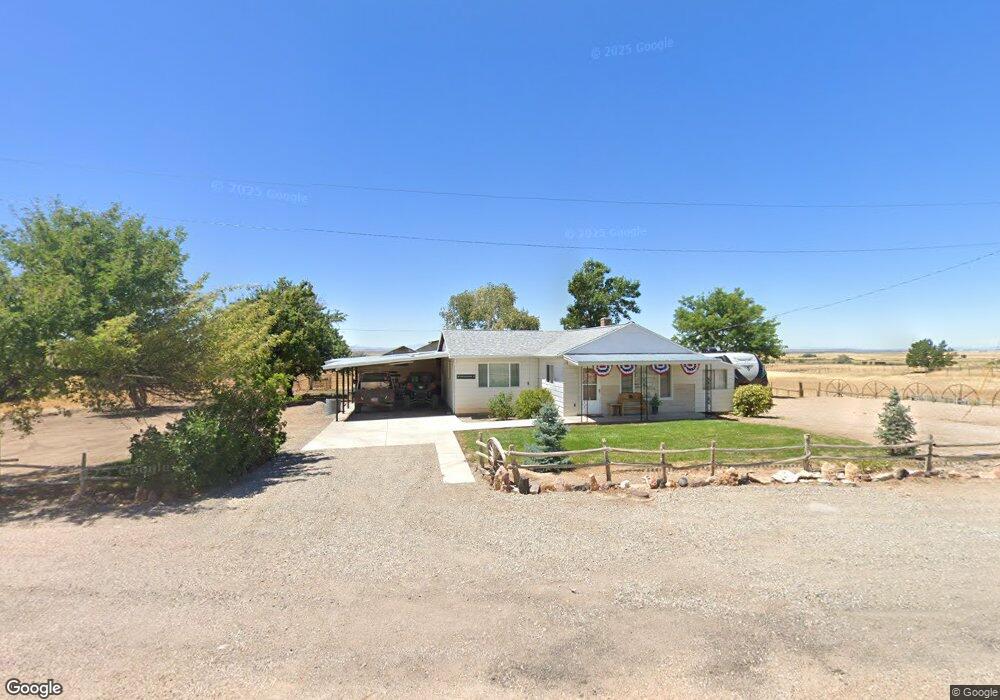
660 S Main St Holden, UT 84636
Estimated Value: $247,394 - $401,000
Studio
--
Bath
--
Sq Ft
0.8
Acres
About This Home
This home is located at 660 S Main St, Holden, UT 84636 and is currently estimated at $291,599. 660 S Main St is a home.
Ownership History
Date
Name
Owned For
Owner Type
Purchase Details
Closed on
Feb 14, 2025
Sold by
Bruner Veneda Bennett
Bought by
Bradshaw Bruce K and Bradshaw Heidi
Current Estimated Value
Home Financials for this Owner
Home Financials are based on the most recent Mortgage that was taken out on this home.
Original Mortgage
$265,000
Outstanding Balance
$263,195
Interest Rate
6.91%
Mortgage Type
Seller Take Back
Estimated Equity
$28,404
Purchase Details
Closed on
Sep 23, 2011
Sold by
Bennett Robert Jay
Bought by
Bruner M James and Bruner Veneda Bennett
Create a Home Valuation Report for This Property
The Home Valuation Report is an in-depth analysis detailing your home's value as well as a comparison with similar homes in the area
Purchase History
| Date | Buyer | Sale Price | Title Company |
|---|---|---|---|
| Bradshaw Bruce K | -- | First American Title | |
| Bradshaw Bruce K | -- | First American Title | |
| Bruner M James | -- | -- |
Source: Public Records
Mortgage History
| Date | Status | Borrower | Loan Amount |
|---|---|---|---|
| Open | Bradshaw Bruce K | $265,000 | |
| Closed | Bradshaw Bruce K | $265,000 |
Source: Public Records
Tax History
| Year | Tax Paid | Tax Assessment Tax Assessment Total Assessment is a certain percentage of the fair market value that is determined by local assessors to be the total taxable value of land and additions on the property. | Land | Improvement |
|---|---|---|---|---|
| 2025 | $1,060 | $136,513 | $23,925 | $112,588 |
| 2024 | $123,024 | $123,024 | $14,287 | $108,737 |
| 2023 | $1,277 | $123,024 | $14,287 | $108,737 |
| 2022 | $1,069 | $98,949 | $11,906 | $87,043 |
| 2021 | $1,255 | $110,969 | $18,039 | $92,930 |
| 2020 | $1,046 | $92,975 | $14,260 | $78,715 |
| 2019 | $1,040 | $92,975 | $14,260 | $78,715 |
| 2018 | $951 | $86,808 | $12,400 | $74,408 |
| 2017 | $944 | $82,169 | $12,400 | $69,769 |
| 2016 | $624 | $56,465 | $7,950 | $48,515 |
| 2015 | $587 | $53,102 | $4,373 | $48,729 |
| 2014 | -- | $53,102 | $4,373 | $48,729 |
| 2013 | -- | $53,102 | $4,373 | $48,729 |
Source: Public Records
Map
Nearby Homes
- 700 W 1100 S
- 600 E 1200 St N
- 3700 W 5800 N
- 205 N 100 E
- 2155 N Cedar Mountain Rd
- 2835 N Cedar Mountain Rd
- 390 N 100 W
- 335 W 400 North St
- 410 W 400 N
- 245 W 300 N
- 225 W 200 St N
- 75 N 100 West St
- 40 S 100 Rd E
- 155 W Center St
- 400 W 2600 North St
- 430 E Canyon Rd
- 235 S 200 St E
- 351 W 100 South St
- 750 800 South Fillmore
- 825 800 South Fillmore
- 492 S Main St
- 200 S S 200 West St St W
- 420 S Main St
- 15 W W 200 South St St
- 355 S 50 E
- 311 S Main St
- 200 S S 200 West St St
- 191 W 300 S
- 280 S Main St
- 200 S S 200 West St St
- 100 S S Hwy
- 254 S Main St
- 254 S Main St
- 245 S Main St
- 100 S S Hwy
- 214 S 100 W
- 241 S 200 W
- 212 S Main St
- 165 W 200 S
- 211 S Main St
Your Personal Tour Guide
Ask me questions while you tour the home.