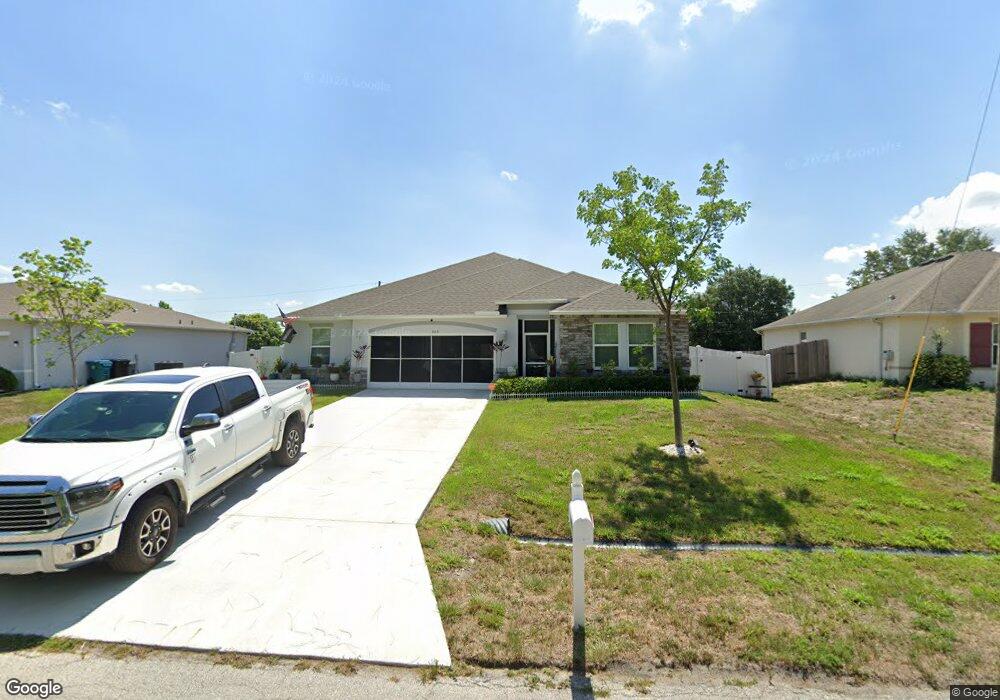
660 SW Jada Rd Port Saint Lucie, FL 34953
Crane Landing NeighborhoodEstimated Value: $435,000 - $525,000
3
Beds
2
Baths
2,274
Sq Ft
$208/Sq Ft
Est. Value
About This Home
This home is located at 660 SW Jada Rd, Port Saint Lucie, FL 34953 and is currently estimated at $472,585, approximately $207 per square foot. 660 SW Jada Rd is a home with nearby schools including Windmill Point Elementary School, Oak Hammock K-8 School, and Bayshore Elementary School.
Ownership History
Date
Name
Owned For
Owner Type
Purchase Details
Closed on
Jan 28, 2022
Sold by
Maronda Homes Llc
Bought by
Miller Albert John and Miller Kathryn G
Current Estimated Value
Home Financials for this Owner
Home Financials are based on the most recent Mortgage that was taken out on this home.
Original Mortgage
$290,680
Outstanding Balance
$269,951
Interest Rate
3.56%
Mortgage Type
New Conventional
Estimated Equity
$202,634
Purchase Details
Closed on
Jan 26, 2021
Sold by
Seheid Terry and Seheid Paula
Bought by
Maronda Homes Llc
Purchase Details
Closed on
Mar 5, 2005
Sold by
Johnson Michael D and Johnson Vicki L
Bought by
Scheid Terry and Scheid Paula
Purchase Details
Closed on
Feb 11, 2003
Sold by
Ocker Peter W and Ocker Phouvieng S
Bought by
Johnson Michael D and Johnson Vicki L
Purchase Details
Closed on
Mar 22, 2002
Sold by
Soulinin Nouan and Soulinin Bouakham
Bought by
Ocker Phouvieng S and Ocker Peter W
Create a Home Valuation Report for This Property
The Home Valuation Report is an in-depth analysis detailing your home's value as well as a comparison with similar homes in the area
Home Values in the Area
Average Home Value in this Area
Purchase History
| Date | Buyer | Sale Price | Title Company |
|---|---|---|---|
| Miller Albert John | $363,400 | Steel City Title | |
| Maronda Homes Llc | $55,000 | Steel City Title | |
| Scheid Terry | $75,900 | Landtech Title Courthouse | |
| Johnson Michael D | $11,500 | -- | |
| Ocker Phouvieng S | $7,000 | -- |
Source: Public Records
Mortgage History
| Date | Status | Borrower | Loan Amount |
|---|---|---|---|
| Open | Miller Albert John | $290,680 |
Source: Public Records
Tax History Compared to Growth
Tax History
| Year | Tax Paid | Tax Assessment Tax Assessment Total Assessment is a certain percentage of the fair market value that is determined by local assessors to be the total taxable value of land and additions on the property. | Land | Improvement |
|---|---|---|---|---|
| 2024 | $5,622 | $271,260 | -- | -- |
| 2023 | $5,622 | $263,360 | $0 | $0 |
| 2022 | $2,118 | $68,300 | $68,300 | $0 |
| 2021 | $603 | $37,800 | $37,800 | $0 |
| 2020 | $722 | $24,000 | $24,000 | $0 |
| 2019 | $704 | $23,100 | $23,100 | $0 |
| 2018 | $639 | $18,000 | $18,000 | $0 |
| 2017 | $606 | $14,600 | $14,600 | $0 |
| 2016 | $583 | $13,200 | $13,200 | $0 |
| 2015 | $557 | $11,100 | $11,100 | $0 |
| 2014 | $518 | $6,490 | $0 | $0 |
Source: Public Records
Map
Nearby Homes
- 684 SW Jada Rd
- 3990 SW Halcomb St
- 4049 SW Port Saint Lucie Blvd
- 590 SW Lacroix Ave
- 4091 SW Port St Lucie Blvd
- 3965 SW Mccain St
- 3998 SW Mccain St
- 543 SW Kabot Ave
- 579 SW Paar Dr
- 662 SW Jacoby Ave
- 4123 SW Port St Lucie Blvd
- 729 SW Haas Ave
- 4089 SW Mcintyre St
- 514 SW Lakota Ave
- 514 SW Kabot Ave
- 766 SW Mccullough Ave
- 514 SW Laconic Ave
- 3950 SW Port St Lucie Blvd
- 499 SW Laconic Ave
- 844 SW Jaslo Ave
- 654 SW Jada Rd
- 666 SW Jada Rd
- 4040 SW Mccrory St
- 4050 SW Mccrory St
- 4030 SW Mccrory St
- 648 SW Jada Rd
- 665 SW Jada Rd
- 4060 SW Mccrory St
- 642 SW Jada Rd
- 657 SW Jada Rd
- 4020 SW Mccrory St
- 672 SW Jada Rd
- 649 SW Jada Rd
- 4070 SW Mccrory St
- 4010 SW Mccrory St
- 673 SW Jada Rd
- 683 SW Jada Rd
- 4041 SW Mccrory St
- 4031 SW Mccrory St
- 4051 SW Mccrory St