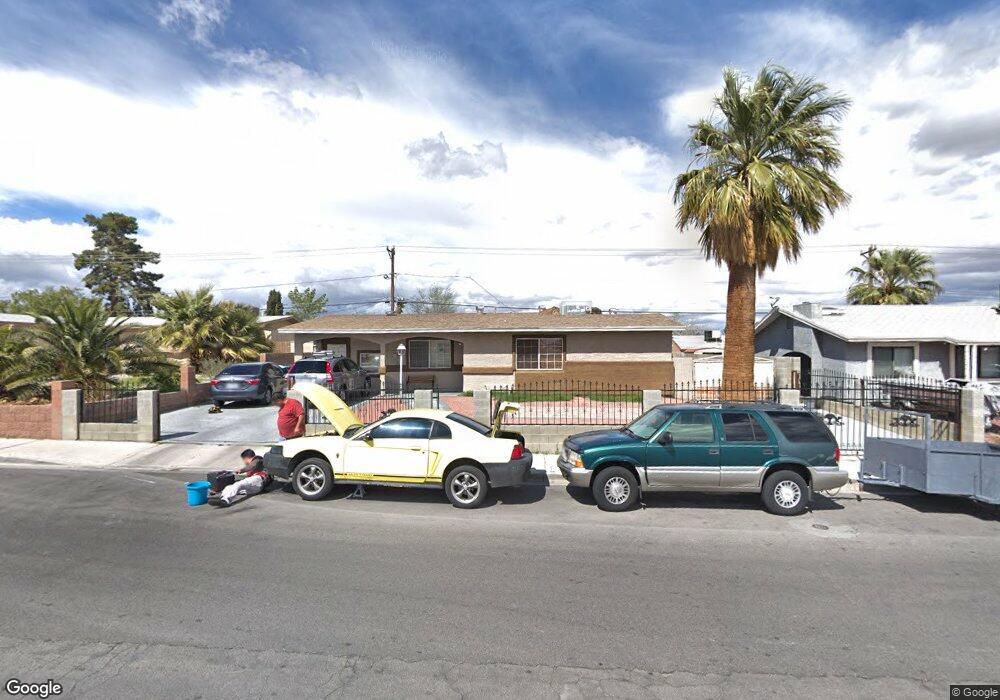
6600 Burgundy Way Las Vegas, NV 89107
Charleston Preservation NeighborhoodEstimated Value: $308,000 - $364,000
3
Beds
2
Baths
1,248
Sq Ft
$273/Sq Ft
Est. Value
About This Home
This home is located at 6600 Burgundy Way, Las Vegas, NV 89107 and is currently estimated at $340,536, approximately $272 per square foot. 6600 Burgundy Way is a home located in Clark County with nearby schools including Rose Warren Elementary School, Frank F Garside Junior High School, and Bonanza High School.
Ownership History
Date
Name
Owned For
Owner Type
Purchase Details
Closed on
Oct 24, 2016
Sold by
Mauricio M Francisca Torres
Bought by
Saldana Jose and Ceballos Elvira
Current Estimated Value
Home Financials for this Owner
Home Financials are based on the most recent Mortgage that was taken out on this home.
Original Mortgage
$81,200
Outstanding Balance
$65,221
Interest Rate
3.52%
Estimated Equity
$275,315
Purchase Details
Closed on
Oct 30, 2000
Sold by
Ceballos Elvira Torres
Bought by
Saldana Jose M Ceballos
Home Financials for this Owner
Home Financials are based on the most recent Mortgage that was taken out on this home.
Original Mortgage
$100,124
Interest Rate
7.9%
Purchase Details
Closed on
Oct 5, 1999
Sold by
Olson Lynn and Olson Cindra
Bought by
Olson Cindra
Home Financials for this Owner
Home Financials are based on the most recent Mortgage that was taken out on this home.
Original Mortgage
$61,675
Interest Rate
7.76%
Mortgage Type
Stand Alone Second
Create a Home Valuation Report for This Property
The Home Valuation Report is an in-depth analysis detailing your home's value as well as a comparison with similar homes in the area
Home Values in the Area
Average Home Value in this Area
Purchase History
| Date | Buyer | Sale Price | Title Company |
|---|---|---|---|
| Saldana Jose | -- | -- | |
| Saldana Jose M Ceballos | -- | United Title | |
| Saldana Jose M Ceballos | $100,950 | United Title | |
| Olson Cindra | -- | First American Title Co |
Source: Public Records
Mortgage History
| Date | Status | Borrower | Loan Amount |
|---|---|---|---|
| Open | Saldana Jose | $81,200 | |
| Closed | Saldana Jose | -- | |
| Previous Owner | Saldana Jose M Ceballos | $100,124 | |
| Previous Owner | Olson Cindra | $61,675 |
Source: Public Records
Tax History Compared to Growth
Tax History
| Year | Tax Paid | Tax Assessment Tax Assessment Total Assessment is a certain percentage of the fair market value that is determined by local assessors to be the total taxable value of land and additions on the property. | Land | Improvement |
|---|---|---|---|---|
| 2025 | $909 | $48,251 | $30,800 | $17,451 |
| 2024 | $883 | $48,251 | $30,800 | $17,451 |
| 2023 | $646 | $46,169 | $30,450 | $15,719 |
| 2022 | $899 | $39,320 | $25,200 | $14,120 |
| 2021 | $833 | $36,579 | $23,450 | $13,129 |
| 2020 | $770 | $32,355 | $19,600 | $12,755 |
| 2019 | $722 | $29,848 | $17,500 | $12,348 |
| 2018 | $689 | $26,284 | $14,700 | $11,584 |
| 2017 | $835 | $25,457 | $14,000 | $11,457 |
| 2016 | $646 | $22,549 | $10,150 | $12,399 |
| 2015 | $644 | $20,382 | $7,700 | $12,682 |
| 2014 | $624 | $18,458 | $5,250 | $13,208 |
Source: Public Records
Map
Nearby Homes
- 6612 Burgundy Way
- 421 Courtney Ln
- 404 Vassar Ln
- 408 Greenfield Ln
- 6508 Bourbon Way
- 416 Lindy Dr
- 325 Greenfield Ln
- 6449 Alta Dr
- 6457 Celeste Ave
- 321 Bent Creek Dr
- 6701 Theus Cir
- 6709 Theus Cir
- 6628 Celeste Ave
- 6409 Burgundy Way
- 309 Warmside Dr
- 6741 Chehalis Cir
- 6444 Bannock Way
- 6412 Bristol Way
- 6420 Evergreen Ave
- 6432 Bannock Way
- 6564 Burgundy Way
- 6604 Burgundy Way
- 6561 Alta Dr
- 6601 Alta Dr
- 6560 Burgundy Way
- 6557 Alta Dr
- 6605 Alta Dr
- 6601 Burgundy Way Unit D1
- 6561 Burgundy Way
- 6605 Burgundy Way
- 6553 Alta Dr
- 6556 Burgundy Way
- 6609 Alta Dr
- 6609 Burgundy Way
- 6557 Burgundy Way
- 6549 Alta Dr
- 6552 Burgundy Way
- 6600 Brandywine Way
- 6613 Alta Dr
- 6560 Brandywine Way