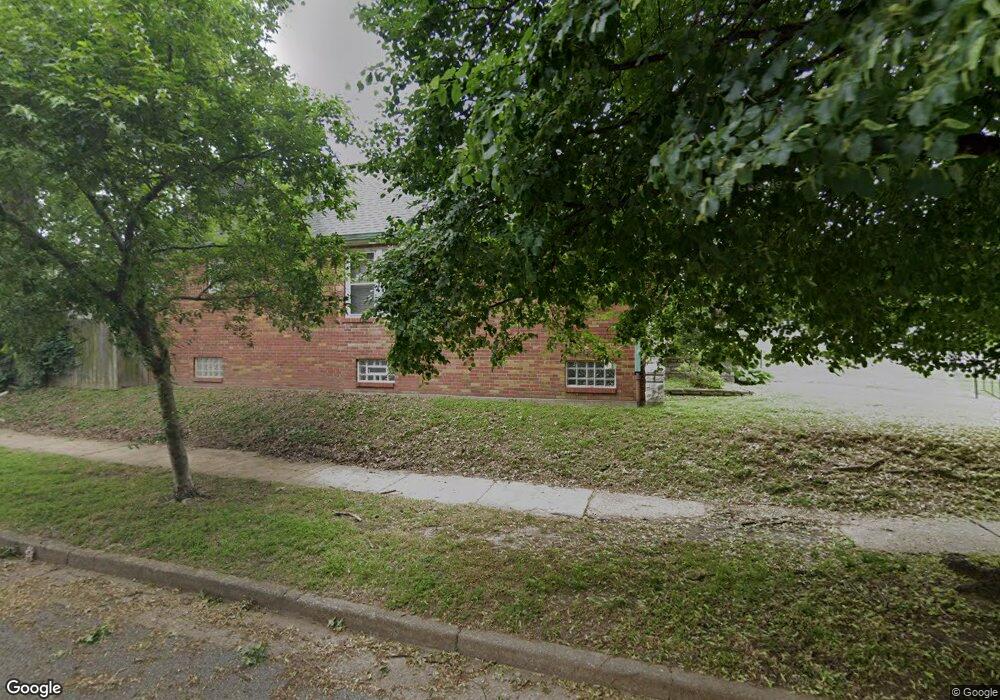
6600 Lindenwood Place Saint Louis, MO 63109
Lindenwood Park NeighborhoodEstimated Value: $321,000 - $350,000
3
Beds
1
Bath
2,350
Sq Ft
$141/Sq Ft
Est. Value
About This Home
This home is located at 6600 Lindenwood Place, Saint Louis, MO 63109 and is currently estimated at $332,259, approximately $141 per square foot. 6600 Lindenwood Place is a home located in St. Louis City with nearby schools including Mason Elementary School, Long International Middle School, and Roosevelt High School.
Ownership History
Date
Name
Owned For
Owner Type
Purchase Details
Closed on
Jul 26, 2008
Sold by
Keller Mark and Keller Christine
Bought by
Salmon Catherine S
Current Estimated Value
Home Financials for this Owner
Home Financials are based on the most recent Mortgage that was taken out on this home.
Original Mortgage
$130,000
Outstanding Balance
$85,907
Interest Rate
6.47%
Mortgage Type
Purchase Money Mortgage
Estimated Equity
$246,352
Purchase Details
Closed on
Oct 21, 2002
Sold by
Keller Mark and Keller Christine
Bought by
Keller Mark and Keller Christine
Purchase Details
Closed on
Jun 20, 2002
Sold by
Heggen Karen F and Gregory Carolyn J
Bought by
Keller Mark and Carlson Christine
Home Financials for this Owner
Home Financials are based on the most recent Mortgage that was taken out on this home.
Original Mortgage
$154,375
Interest Rate
5.75%
Mortgage Type
Purchase Money Mortgage
Create a Home Valuation Report for This Property
The Home Valuation Report is an in-depth analysis detailing your home's value as well as a comparison with similar homes in the area
Home Values in the Area
Average Home Value in this Area
Purchase History
| Date | Buyer | Sale Price | Title Company |
|---|---|---|---|
| Salmon Catherine S | -- | None Available | |
| Keller Mark | -- | -- | |
| Keller Mark | -- | -- |
Source: Public Records
Mortgage History
| Date | Status | Borrower | Loan Amount |
|---|---|---|---|
| Open | Salmon Catherine S | $130,000 | |
| Previous Owner | Keller Mark | $154,375 |
Source: Public Records
Tax History Compared to Growth
Tax History
| Year | Tax Paid | Tax Assessment Tax Assessment Total Assessment is a certain percentage of the fair market value that is determined by local assessors to be the total taxable value of land and additions on the property. | Land | Improvement |
|---|---|---|---|---|
| 2025 | $3,488 | $48,950 | $3,330 | $45,620 |
| 2024 | $3,318 | $41,340 | $3,330 | $38,010 |
| 2023 | $3,318 | $41,340 | $3,330 | $38,010 |
| 2022 | $3,160 | $37,890 | $3,330 | $34,560 |
| 2021 | $3,156 | $37,890 | $3,330 | $34,560 |
| 2020 | $2,874 | $34,750 | $3,330 | $31,420 |
| 2019 | $2,864 | $34,760 | $3,330 | $31,430 |
| 2018 | $2,770 | $32,560 | $3,000 | $29,560 |
| 2017 | $2,723 | $32,570 | $3,000 | $29,560 |
| 2016 | $2,479 | $29,240 | $3,000 | $26,240 |
| 2015 | $2,247 | $29,240 | $3,000 | $26,240 |
| 2014 | $2,132 | $29,240 | $3,000 | $26,240 |
| 2013 | -- | $27,740 | $3,000 | $24,740 |
Source: Public Records
Map
Nearby Homes
- 6565 Winnebago St
- 6541 Lindenwood Place
- 6561 Bancroft Ave
- 6621 Tholozan Ave
- 6517 Tholozan Ave
- 6659 Tholozan Ave
- 6611 Pernod Ave
- 6439 Mardel Ave
- 6631 Pernod Ave
- 6409 Sutherland Ave
- 6709 Lansdowne Ave
- 6656 Oleatha Ave
- 3905 Tamm Ave
- 6600 Devonshire Ave Unit 5
- 6637 Devonshire Ave Unit 2
- 6973 Winona Ave
- 6663 Devonshire Ave
- 6811 Marquette Ave
- 6335 Devonshire Ave
- 6625 Hancock Ave
- 6604 Lindenwood Place
- 6608 Lindenwood Place
- 6574 Lindenwood Place
- 6612 Lindenwood Place
- 6601 Winnebago St
- 6614 Lindenwood Place
- 6609 Winnebago St
- 6571 Winnebago St
- 6566 Lindenwood Place
- 6611 Winnebago St
- 6618 Lindenwood Place
- 6601 Lindenwood Place
- 6567 Winnebago St
- 6615 Winnebago St
- 6605 Lindenwood Place
- 6564 Lindenwood Place
- 6609 Lindenwood Place
- 6622 Lindenwood Place
- 6619 Winnebago St
- 6611 Lindenwood Place