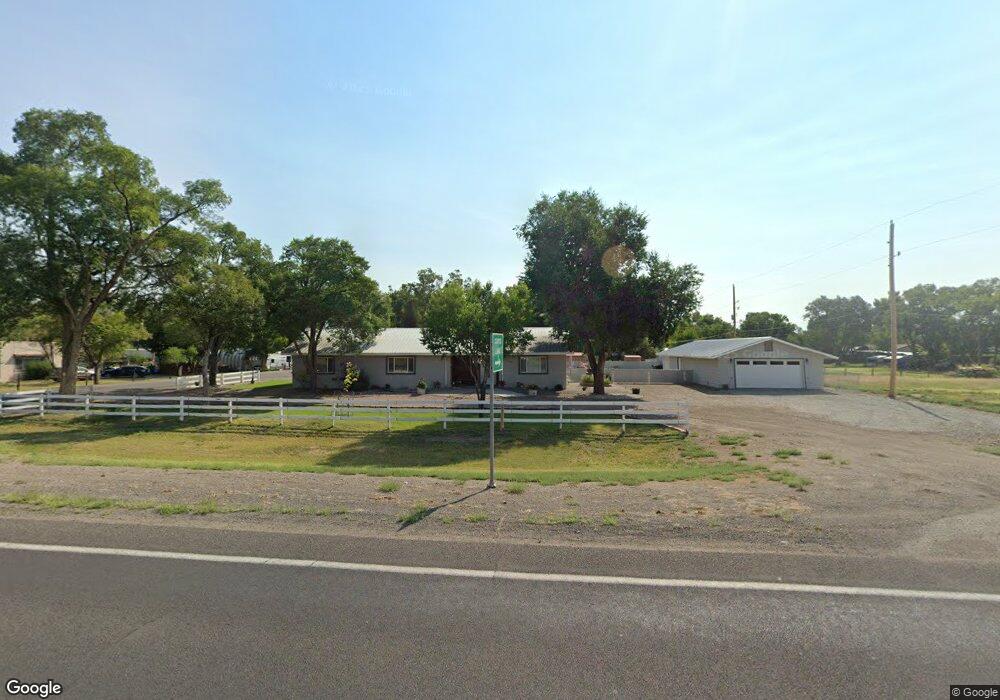
6600 State Highway 17 Alamosa, CO 81101
Estimated Value: $330,000 - $400,000
4
Beds
2
Baths
2,261
Sq Ft
$158/Sq Ft
Est. Value
About This Home
This home is located at 6600 State Highway 17, Alamosa, CO 81101 and is currently estimated at $356,551, approximately $157 per square foot. 6600 State Highway 17 is a home located in Alamosa County with nearby schools including Alamosa Elementary School, Ortega Middle School, and Alamosa High School.
Ownership History
Date
Name
Owned For
Owner Type
Purchase Details
Closed on
Nov 18, 2019
Sold by
High Tom L and Romero Cedric Joseph
Bought by
High Tom L and Romero Cedric Joseph
Current Estimated Value
Purchase Details
Closed on
Nov 30, 2012
Sold by
Wuckert Luke
Bought by
Worley Tom and Worley Delzia
Home Financials for this Owner
Home Financials are based on the most recent Mortgage that was taken out on this home.
Original Mortgage
$199,500
Outstanding Balance
$138,481
Interest Rate
3.41%
Mortgage Type
New Conventional
Estimated Equity
$218,070
Purchase Details
Closed on
Nov 16, 2010
Sold by
Trosper Milton F and Trosper Linda K
Bought by
Cit Mortgage Loan Trust 2007-1
Purchase Details
Closed on
Jun 6, 1996
Sold by
Rogers Linda K
Bought by
Trosper Milton F and Trosper Linda K
Purchase Details
Closed on
May 9, 1989
Sold by
Rogers J M
Bought by
Rogers Linda K
Purchase Details
Closed on
Aug 3, 1978
Sold by
Long Roy A
Bought by
Rogers J M
Create a Home Valuation Report for This Property
The Home Valuation Report is an in-depth analysis detailing your home's value as well as a comparison with similar homes in the area
Home Values in the Area
Average Home Value in this Area
Purchase History
| Date | Buyer | Sale Price | Title Company |
|---|---|---|---|
| High Tom L | -- | None Available | |
| Worley Tom | $210,000 | None Available | |
| Cit Mortgage Loan Trust 2007-1 | -- | None Available | |
| Trosper Milton F | -- | -- | |
| Rogers Linda K | -- | -- | |
| Rogers J M | $43,000 | -- |
Source: Public Records
Mortgage History
| Date | Status | Borrower | Loan Amount |
|---|---|---|---|
| Open | Worley Tom | $199,500 |
Source: Public Records
Tax History Compared to Growth
Tax History
| Year | Tax Paid | Tax Assessment Tax Assessment Total Assessment is a certain percentage of the fair market value that is determined by local assessors to be the total taxable value of land and additions on the property. | Land | Improvement |
|---|---|---|---|---|
| 2024 | $1,016 | $16,366 | $670 | $15,696 |
| 2023 | $1,040 | $16,525 | $677 | $15,848 |
| 2022 | $1,226 | $14,776 | $536 | $14,240 |
| 2021 | $1,260 | $14,776 | $536 | $14,240 |
| 2020 | $1,186 | $14,776 | $536 | $14,240 |
| 2019 | $1,189 | $13,673 | $358 | $13,315 |
| 2018 | $1,184 | $13,389 | $360 | $13,029 |
| 2017 | $1,185 | $13,389 | $360 | $13,029 |
| 2016 | $1,166 | $13,229 | $398 | $12,831 |
| 2015 | $1,165 | $13,229 | $398 | $12,831 |
| 2014 | -- | $13,174 | $398 | $12,776 |
| 2013 | -- | $13,174 | $398 | $12,776 |
Source: Public Records
Map
Nearby Homes
- 295 Sunnyside Ln
- 309 Sunnyside Ln
- 0 McKinney White Pine Unit REC1813333
- TBD County Road 6 S
- 1018 State St
- 5895 State Highway 17
- 61 Conejos Ave
- 12 Rio Grande Ave
- 00 E Us Highway 160
- 631 2nd St
- 735 First St
- 6 Mountain View Place
- 6755 Trinchera Ln
- 0 Mountain View Blvd Unit 23881373
- 6 Bellwood Dr
- Lot 14 Fourth St
- 24 Alamosa Ave
- 302 Bell Ave
- 711 Cottonwood Cir
- 1623-B 6th St
- 6600 Colorado 17
- 6600 State Highway 17
- 150 Curtis Ln
- 103 Curtis Ln
- 160 Curtis Ln
- 141 Curtis Ln
- 135 Tinkham Ln
- 171 Curtis Ln
- 170 Curtis Ln
- 155 Tinkham Ln
- 6482 State Highway 17 Unit 4
- 6482 State Highway 17 Unit 22
- 6482 State Highway 17 Unit 3
- 6482 State Highway 17 Unit 5
- 6482 State Highway 17 Unit 2
- 6482 State Highway 17 Unit 12
- 6482 State Highway 17 Unit 14
- 6482 State Highway 17
- 157 Tinkham Ln
- 180 Curtis Ln