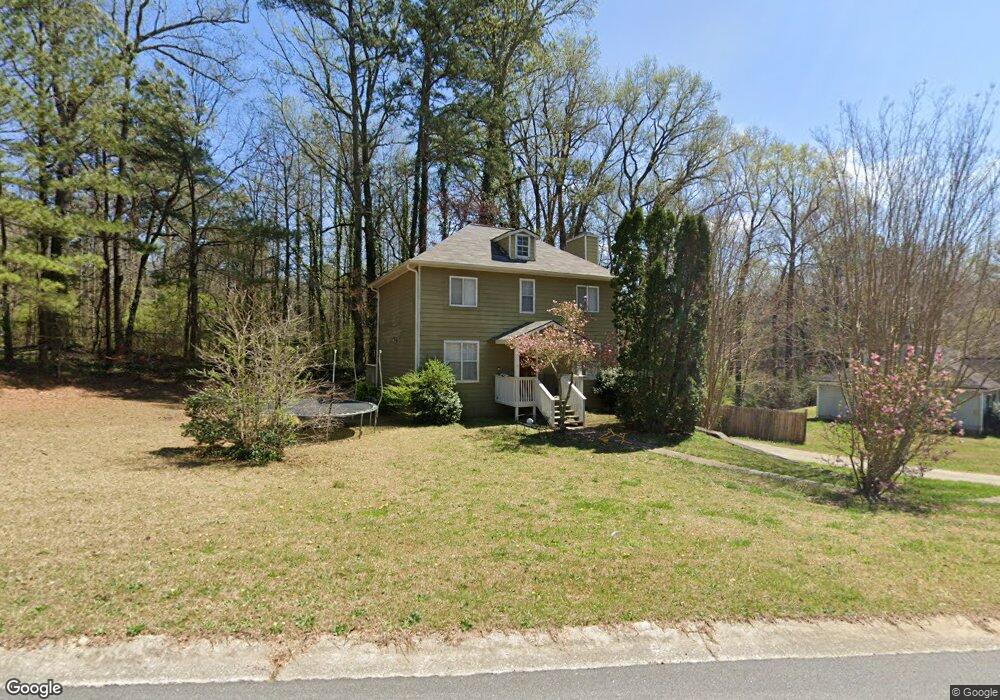
6601 Crossing Creek Point Austell, GA 30168
Estimated Value: $262,000 - $345,000
3
Beds
3
Baths
1,542
Sq Ft
$186/Sq Ft
Est. Value
About This Home
This home is located at 6601 Crossing Creek Point, Austell, GA 30168 and is currently estimated at $287,172, approximately $186 per square foot. 6601 Crossing Creek Point is a home located in Cobb County with nearby schools including Bryant Elementary School, Lindley Middle School, and Pebblebrook High School.
Ownership History
Date
Name
Owned For
Owner Type
Purchase Details
Closed on
Sep 2, 2004
Sold by
Option One Mtg Loan Trust 2001
Bought by
Rodgers Kenroy
Current Estimated Value
Home Financials for this Owner
Home Financials are based on the most recent Mortgage that was taken out on this home.
Original Mortgage
$98,400
Outstanding Balance
$48,536
Interest Rate
5.92%
Mortgage Type
New Conventional
Estimated Equity
$238,636
Purchase Details
Closed on
May 4, 2004
Sold by
Mascoe Stephen
Bought by
Option One Mtg Loan Trust 2001-A
Purchase Details
Closed on
Apr 20, 2000
Sold by
Morgan Danielle
Bought by
Mascoe Stephen
Home Financials for this Owner
Home Financials are based on the most recent Mortgage that was taken out on this home.
Original Mortgage
$121,600
Interest Rate
8.24%
Mortgage Type
New Conventional
Purchase Details
Closed on
Jan 6, 1998
Sold by
Ft Mtg Companies
Bought by
Sec Hud
Create a Home Valuation Report for This Property
The Home Valuation Report is an in-depth analysis detailing your home's value as well as a comparison with similar homes in the area
Home Values in the Area
Average Home Value in this Area
Purchase History
| Date | Buyer | Sale Price | Title Company |
|---|---|---|---|
| Rodgers Kenroy | $123,000 | -- | |
| Option One Mtg Loan Trust 2001-A | $131,146 | -- | |
| Mascoe Stephen | $128,000 | -- | |
| Sec Hud | -- | -- | |
| Ft Mtg Companies | $85,400 | -- |
Source: Public Records
Mortgage History
| Date | Status | Borrower | Loan Amount |
|---|---|---|---|
| Open | Rodgers Kenroy | $98,400 | |
| Previous Owner | Mascoe Stephen | $121,600 |
Source: Public Records
Tax History Compared to Growth
Tax History
| Year | Tax Paid | Tax Assessment Tax Assessment Total Assessment is a certain percentage of the fair market value that is determined by local assessors to be the total taxable value of land and additions on the property. | Land | Improvement |
|---|---|---|---|---|
| 2025 | $3,289 | $109,152 | $24,000 | $85,152 |
| 2024 | $3,107 | $103,056 | $20,000 | $83,056 |
| 2023 | $3,107 | $103,056 | $20,000 | $83,056 |
| 2022 | $3,128 | $103,056 | $20,000 | $83,056 |
| 2021 | $1,911 | $62,968 | $14,000 | $48,968 |
| 2020 | $1,911 | $62,968 | $14,000 | $48,968 |
| 2019 | $1,688 | $55,612 | $10,000 | $45,612 |
| 2018 | $1,451 | $47,824 | $6,000 | $41,824 |
| 2017 | $943 | $32,816 | $6,000 | $26,816 |
| 2016 | $943 | $32,816 | $6,000 | $26,816 |
| 2015 | $787 | $26,704 | $13,600 | $13,104 |
| 2014 | $793 | $26,704 | $0 | $0 |
Source: Public Records
Map
Nearby Homes
- 6609 Crossing Creek Point
- 1086 S Gordon Rd
- 1202 Pisgah Rd SW
- 840 Revena Dr
- 817 Revena Dr
- 1142 Hembree Ln
- 00 Hembree Ln
- 0 Hembree Ln Unit 10633605
- 6675 S Dillon Rd
- 1310 Dillon Rd
- 1065 Stoney Creek Ln Unit 2
- 1076 Stoney Creek Ln
- 7098 Pleasant Dr
- 6651 Malvin Dr
- 6736 Ivy Log Dr
- 1576 S Gordon Rd
- 6302 Mount Pisgah Ln
- 1243 Blairs Pointe Dr Unit 3
- 6603 Crossing Creek Point
- 6602 Crossing Creek
- 6600 Crossing Creek Point
- 6604 Crossing Creek Point
- 6602 Crossing Creek Place
- 6605 Crossing Creek Point
- 6606 Crossing Creek
- 6606 Crossing Creek Point
- 6608 Crossing Creek Point
- 6596 Crossing Creek Point
- 1229 S Gordon Rd
- 6610 Crossing Creek Point
- 6610 Crossing Creek
- S S Gordon Rd SW Unit O
- S S Gordon Rd SW Unit 27
- 640 S Gordon Rd SW
- S S Gordon Rd SW
- 1247 S Gordon Rd
- 1171 S Gordon Rd
- 1154 Shady Ridge Place