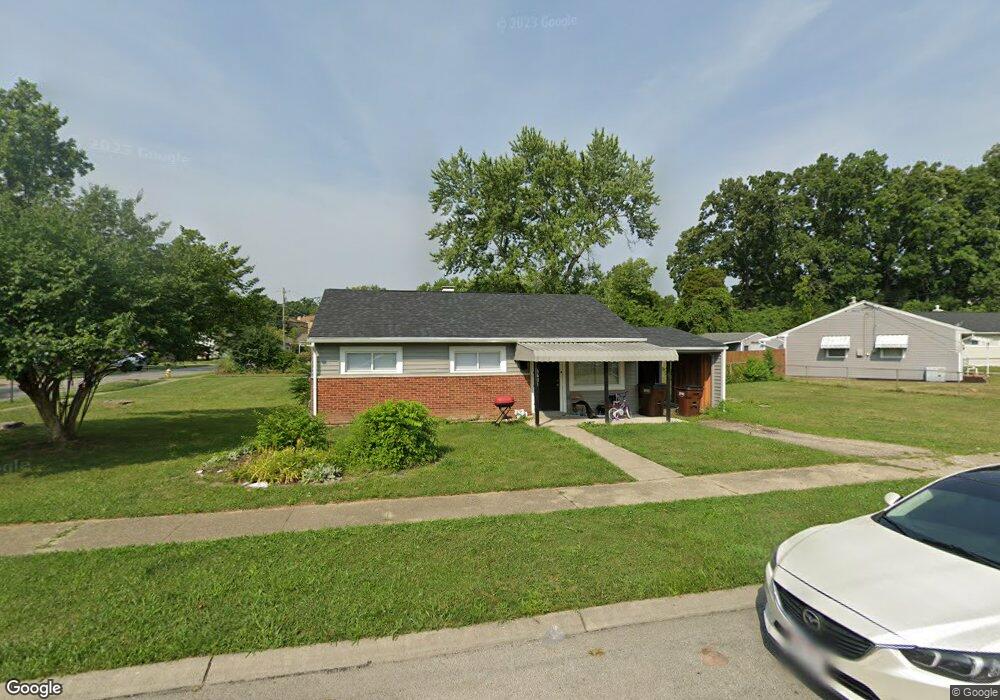
6601 Flagstone Ct Cincinnati, OH 45239
Estimated Value: $107,000 - $169,000
3
Beds
1
Bath
918
Sq Ft
$147/Sq Ft
Est. Value
About This Home
This home is located at 6601 Flagstone Ct, Cincinnati, OH 45239 and is currently estimated at $134,996, approximately $147 per square foot. 6601 Flagstone Ct is a home located in Hamilton County with nearby schools including White Oak Middle School, Colerain High School, and Cincinnati Achievement Academy.
Ownership History
Date
Name
Owned For
Owner Type
Purchase Details
Closed on
Jan 31, 2022
Sold by
Northfield Construction Llc
Bought by
Sfr3-060 Llc
Current Estimated Value
Purchase Details
Closed on
Dec 21, 2021
Sold by
Bruce Jada
Bought by
Northfield Construction Llc
Purchase Details
Closed on
Sep 28, 2021
Sold by
Osbourne Deangel
Bought by
Northfield Construction Llc
Purchase Details
Closed on
Aug 31, 2021
Sold by
Williams Jennie and Williams John
Bought by
Northfield Construction Llc
Purchase Details
Closed on
Aug 20, 2021
Sold by
Smith Anita and Smith Frank
Bought by
Northfield Construction Llc
Purchase Details
Closed on
Nov 16, 2020
Sold by
Estate Of Dale L Bruce
Bought by
Smith Anita and Williams Jennie
Create a Home Valuation Report for This Property
The Home Valuation Report is an in-depth analysis detailing your home's value as well as a comparison with similar homes in the area
Home Values in the Area
Average Home Value in this Area
Purchase History
| Date | Buyer | Sale Price | Title Company |
|---|---|---|---|
| Sfr3-060 Llc | -- | None Listed On Document | |
| Northfield Construction Llc | -- | None Listed On Document | |
| Northfield Construction Llc | -- | None Listed On Document | |
| Northfield Construction Llc | -- | None Listed On Document | |
| Northfield Construction Llc | -- | None Listed On Document | |
| Northfield Construction Llc | -- | None Listed On Document | |
| Northfield Construction Llc | -- | None Listed On Document | |
| Northfield Construction Llc | -- | None Listed On Document | |
| Smith Anita | -- | None Available |
Source: Public Records
Tax History
| Year | Tax Paid | Tax Assessment Tax Assessment Total Assessment is a certain percentage of the fair market value that is determined by local assessors to be the total taxable value of land and additions on the property. | Land | Improvement |
|---|---|---|---|---|
| 2025 | $1,662 | $28,000 | $10,164 | $17,836 |
| 2024 | $1,583 | $28,000 | $10,164 | $17,836 |
| 2023 | $1,565 | $28,000 | $10,164 | $17,836 |
| 2022 | $1,690 | $24,759 | $8,974 | $15,785 |
| 2021 | $2,214 | $24,759 | $8,974 | $15,785 |
| 2020 | $2,129 | $24,759 | $8,974 | $15,785 |
| 2019 | $1,909 | $19,968 | $7,238 | $12,730 |
| 2018 | $1,320 | $19,968 | $7,238 | $12,730 |
| 2017 | $673 | $19,968 | $7,238 | $12,730 |
| 2016 | $689 | $20,192 | $7,235 | $12,957 |
| 2015 | $704 | $20,192 | $7,235 | $12,957 |
| 2014 | $705 | $20,192 | $7,235 | $12,957 |
| 2013 | $734 | $21,256 | $7,616 | $13,640 |
Source: Public Records
Map
Nearby Homes
- 3191 Preserve Ln
- 3181 Preserve Ln
- 3181 Preserve Ln Unit 1C
- 3250 March Terrace
- 3140 Banning Rd
- 2820 Geraldine Dr
- 2806 Breezy Way
- 2801 Byrneside Dr
- 2836 Banning Rd
- 6635 July Ct
- 6893 Newbridge Dr
- 2757 Banning Rd
- 6278 Seiler Dr
- 2730 Byrneside Dr
- 6751 Rutherford Ct
- 3407 Lapland Dr
- 5970 Colerain Ave
- 2937 Blue Rock Rd
- 6321 Duet Ln
- 6184 Seiler Dr
- 3088 Lapland Dr
- 6609 Flagstone Ct
- 6600 Flagstone Ct
- 3098 Lapland Dr
- 6606 Flagstone Ct
- 3052 Lapland Dr
- 6615 Flagstone Ct
- 3079 Lapland Dr
- 3071 Lapland Dr
- 3087 Lapland Dr
- 6612 Flagstone Ct
- 3063 Lapland Dr
- 3095 Lapland Dr
- 3118 Lapland Dr
- 3044 Lapland Dr
- 6621 Flagstone Ct
- 6618 Flagstone Ct
- 3053 Lapland Dr
- 3103 Lapland Dr
- 6624 Flagstone Ct
Your Personal Tour Guide
Ask me questions while you tour the home.