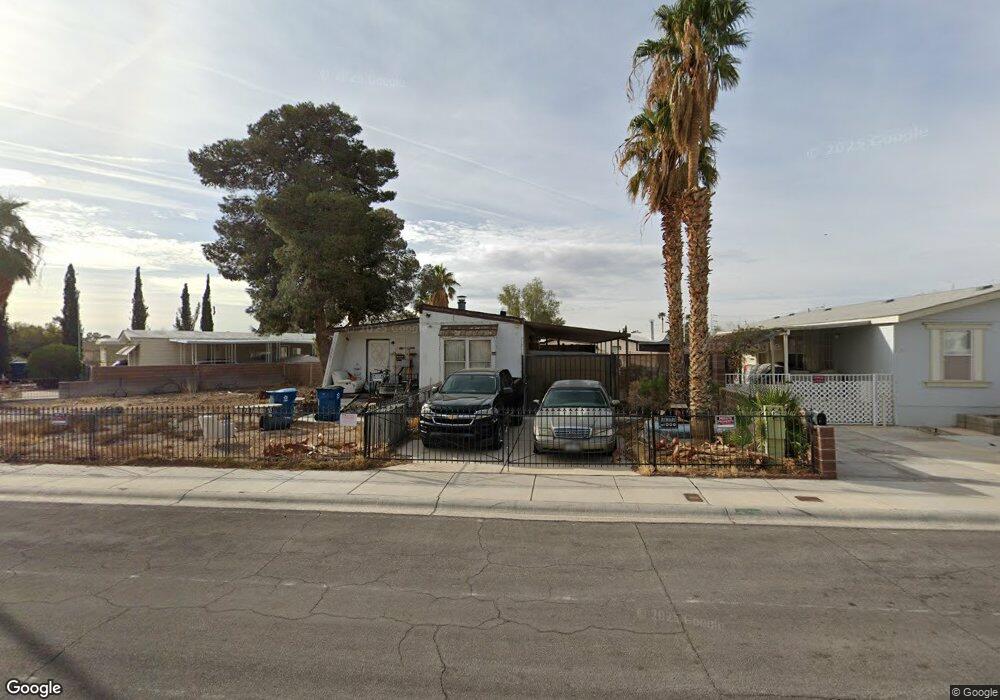
6601 Pearblossom Ln Las Vegas, NV 89108
Woodcrest NeighborhoodEstimated Value: $264,000 - $305,000
2
Beds
2
Baths
1,446
Sq Ft
$195/Sq Ft
Est. Value
About This Home
This home is located at 6601 Pearblossom Ln, Las Vegas, NV 89108 and is currently estimated at $282,298, approximately $195 per square foot. 6601 Pearblossom Ln is a home located in Clark County with nearby schools including Ruthe Deskin Elementary School, Justice Myron E Leavitt Middle School, and Centennial High School.
Ownership History
Date
Name
Owned For
Owner Type
Purchase Details
Closed on
Nov 27, 2018
Sold by
Vining David K
Bought by
Vining David K and The David K Vining Living Trust
Current Estimated Value
Purchase Details
Closed on
Mar 5, 2008
Sold by
Vining David K and Vining Amy E
Bought by
Vining David K
Purchase Details
Closed on
Jul 6, 2005
Sold by
Vining David K and Vining Amy E
Bought by
Vining David K and Vining Amy E
Purchase Details
Closed on
Mar 17, 2004
Sold by
Flippin Clay M
Bought by
Vining David K and Vining Amy E
Home Financials for this Owner
Home Financials are based on the most recent Mortgage that was taken out on this home.
Original Mortgage
$89,600
Interest Rate
5.69%
Mortgage Type
Unknown
Purchase Details
Closed on
Oct 21, 1997
Sold by
Sage Gerald S and Sage Nancy
Bought by
Flippin Clay M
Home Financials for this Owner
Home Financials are based on the most recent Mortgage that was taken out on this home.
Original Mortgage
$88,695
Interest Rate
7.23%
Mortgage Type
FHA
Create a Home Valuation Report for This Property
The Home Valuation Report is an in-depth analysis detailing your home's value as well as a comparison with similar homes in the area
Home Values in the Area
Average Home Value in this Area
Purchase History
| Date | Buyer | Sale Price | Title Company |
|---|---|---|---|
| Vining David K | -- | None Available | |
| Vining David K | $150,000 | Chicago Title | |
| Vining David K | -- | -- | |
| Vining David K | $112,000 | Lawyers Title Of Nevada | |
| Flippin Clay M | $90,000 | Old Republic Title Company |
Source: Public Records
Mortgage History
| Date | Status | Borrower | Loan Amount |
|---|---|---|---|
| Previous Owner | Vining David K | $89,600 | |
| Previous Owner | Flippin Clay M | $88,695 |
Source: Public Records
Tax History Compared to Growth
Tax History
| Year | Tax Paid | Tax Assessment Tax Assessment Total Assessment is a certain percentage of the fair market value that is determined by local assessors to be the total taxable value of land and additions on the property. | Land | Improvement |
|---|---|---|---|---|
| 2025 | $1,429 | $44,731 | $21,840 | $22,891 |
| 2024 | $643 | $44,731 | $21,840 | $22,891 |
| 2023 | $643 | $43,435 | $21,000 | $22,435 |
| 2022 | $524 | $37,850 | $16,800 | $21,050 |
| 2021 | $511 | $35,092 | $14,700 | $20,392 |
| 2020 | $491 | $33,226 | $12,600 | $20,626 |
| 2019 | $477 | $29,194 | $8,400 | $20,794 |
| 2018 | $464 | $28,885 | $8,400 | $20,485 |
| 2017 | $885 | $29,651 | $8,400 | $21,251 |
| 2016 | $439 | $21,873 | $7,140 | $14,733 |
| 2015 | $438 | $15,414 | $6,300 | $9,114 |
| 2014 | $424 | $15,528 | $6,300 | $9,228 |
Source: Public Records
Map
Nearby Homes
- 6628 Plumflower Ln
- 4252 Orangeblossom St
- 6521 Faith Peak Dr
- 6802 W Craig Rd
- 4232 Orangeblossom Ct
- 4229 Jadestone Ave
- 6508 Faith Peak Dr
- 5031 N Rainbow Blvd Unit 110
- 6741 Accent Ct
- 6732 Accent Ct
- 6633 Wheelbarrow Peak Dr
- 6421 Doby Peak Dr
- 6900 Quail Hollow Dr
- 6425 Wheelbarrow Peak Dr
- 4113 Compass Rose Way
- 6608 Messenger Ct
- 4217 Jasper Ave
- 6429 Roy Rogers Dr Unit 2
- 6636 Painted Desert Dr
- 4012 Mira Ln
- 4312 Carnation Ln
- 6605 Pearblossom Ln
- 6609 Pearblossom Ln
- 6624 Hartman St
- 6604 Pearblossom Ln
- 4313 Carnation Ln
- 6600 Pearblossom Ln
- 6632 Hartman St
- 4304 Carnation Ln
- 6620 Hartman St
- 6612 Pearblossom Ln
- 6636 Hartman St
- 4328 Zinnia Ln
- 4324 Zinnia Ln
- 6616 Pearblossom Ln
- 6601 Plumflower Ln
- 6613 Plumflower Ln
- 6617 Pearblossom Ln
- 6640 Hartman St
- 4301 Carnation Ln