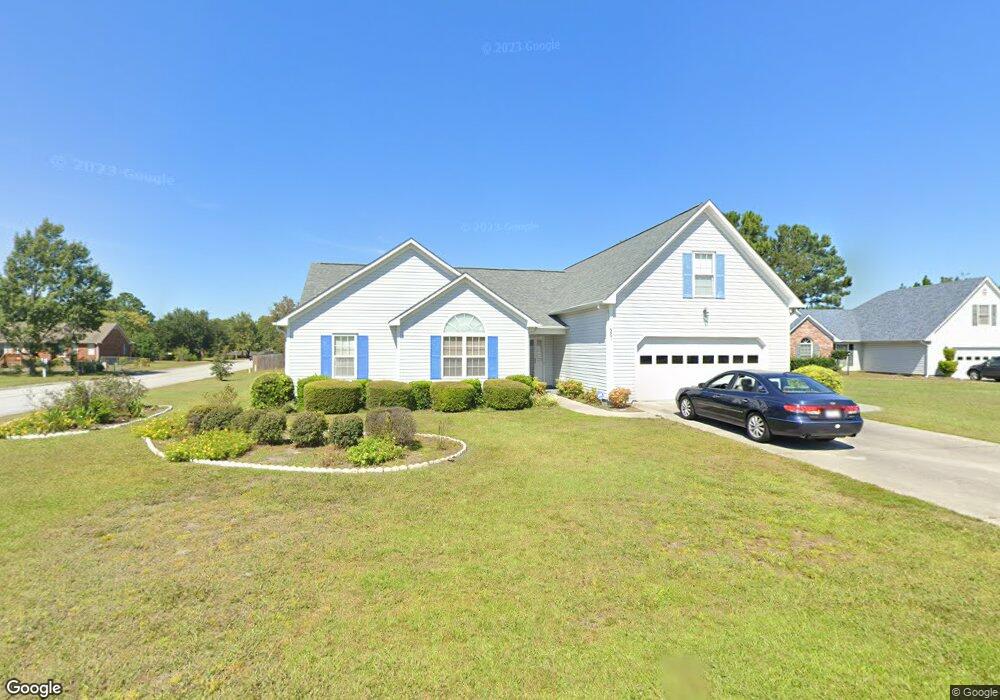
6601 Rowsgate Ln Wilmington, NC 28411
Estimated Value: $470,000 - $523,000
3
Beds
3
Baths
2,192
Sq Ft
$223/Sq Ft
Est. Value
About This Home
This home is located at 6601 Rowsgate Ln, Wilmington, NC 28411 and is currently estimated at $489,000, approximately $223 per square foot. 6601 Rowsgate Ln is a home located in New Hanover County with nearby schools including Murrayville Elementary School, Emma B. Trask Middle School, and Emsley A. Laney High School.
Ownership History
Date
Name
Owned For
Owner Type
Purchase Details
Closed on
Oct 12, 2023
Sold by
Johnson Harrell L and Johnson Terrence L
Bought by
Johnson Harrell L and Johnson Terrence L
Current Estimated Value
Purchase Details
Closed on
Dec 13, 2010
Sold by
Johnson Karen and Johnson Harrell L
Bought by
Johnson Harrell L and Johnson Terrence L
Purchase Details
Closed on
Oct 9, 2007
Sold by
Johnson Johnson Karen Karen and Johnson Murphy Karen
Bought by
Johnson Karen and Johnson Harrell L
Purchase Details
Closed on
Nov 14, 2003
Sold by
Murphy Daren
Bought by
Murphy Karen Johnson
Purchase Details
Closed on
Jul 1, 1988
Bought by
Coastal Carolina Dev Inc
Create a Home Valuation Report for This Property
The Home Valuation Report is an in-depth analysis detailing your home's value as well as a comparison with similar homes in the area
Home Values in the Area
Average Home Value in this Area
Purchase History
| Date | Buyer | Sale Price | Title Company |
|---|---|---|---|
| Johnson Harrell L | -- | None Listed On Document | |
| Johnson Harrell L | -- | None Listed On Document | |
| Johnson Harrell L | -- | None Available | |
| Johnson Karen | -- | None Available | |
| Murphy Karen Johnson | -- | -- | |
| Johnson Karen M | $168,000 | -- | |
| Southern Homebuilders Inc | $31,500 | -- | |
| Coastal Carolina Dev Inc | -- | -- |
Source: Public Records
Tax History Compared to Growth
Tax History
| Year | Tax Paid | Tax Assessment Tax Assessment Total Assessment is a certain percentage of the fair market value that is determined by local assessors to be the total taxable value of land and additions on the property. | Land | Improvement |
|---|---|---|---|---|
| 2025 | $1,801 | $456,400 | $127,500 | $328,900 |
| 2024 | $1,702 | $311,700 | $78,400 | $233,300 |
| 2023 | $1,696 | $311,700 | $78,400 | $233,300 |
| 2022 | $1,712 | $311,700 | $78,400 | $233,300 |
| 2021 | $1,719 | $311,700 | $78,400 | $233,300 |
| 2020 | $1,444 | $228,300 | $47,300 | $181,000 |
| 2019 | $1,444 | $228,300 | $47,300 | $181,000 |
| 2018 | $1,444 | $228,300 | $47,300 | $181,000 |
| 2017 | $1,478 | $228,300 | $47,300 | $181,000 |
| 2016 | $1,568 | $226,300 | $47,300 | $179,000 |
| 2015 | $1,457 | $226,300 | $47,300 | $179,000 |
| 2014 | $1,432 | $226,300 | $47,300 | $179,000 |
Source: Public Records
Map
Nearby Homes
- 807 Spy Glass Ct
- 901 Sheffield Dr
- 816 Plainfield Ct
- 6636 Shire Ln
- 2409 White Rd
- 4905 Tupelo Dr
- 2401 Sapling Cir
- 2513 Sapling Cir
- 2520 Sapling Cir
- 402 Governors Rd
- 1108 Sheffield Ct
- 2712 White Rd
- 4844 Acres Dr
- 5332 Sun Coast Dr
- 814 Bay Blossom Dr
- 6105 Northshore Dr
- 7406 Privet Ct
- 7012 Brittany Lakes Dr
- Lot 184 Murrayville Rd
- 4826 Castleboro Ct
- 6603 Rowsgate Ln
- 5935 Rowsgate Ln
- 6600 Newbury Way
- 6604 Newbury Way
- 6605 Rowsgate Ln
- 6504 Newbury Way
- 6600 Rowsgate Ln
- 6608 Newbury Way
- 5929 Rowsgate Ln
- 5936 Rowsgate Ln
- 6602 Rowsgate Ln
- 6606 Rowsgate Ln
- 6502 Newbury Way
- 6612 Newbury Way
- 5925 Rowsgate Ln
- 6616 Newbury Way
- 901 Rectory Ct
- 5921 Rowsgate Ln
- 6601 Newbury Way
- 1001 Shenandoah St