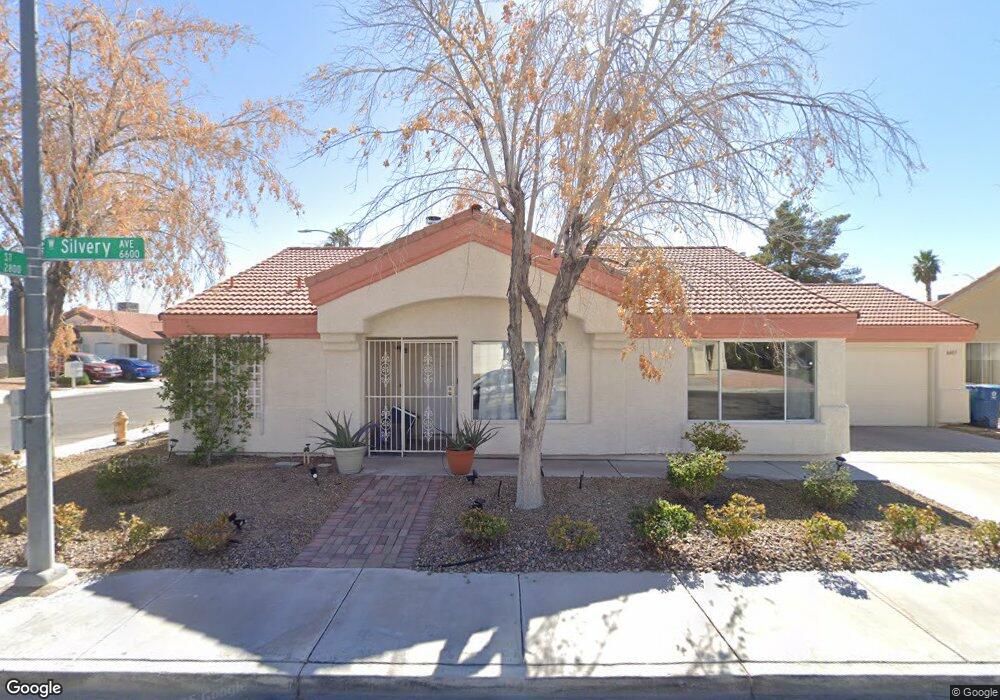
6601 Silvery Ave Las Vegas, NV 89108
Michael Way NeighborhoodEstimated Value: $343,402 - $376,000
3
Beds
2
Baths
1,249
Sq Ft
$287/Sq Ft
Est. Value
About This Home
This home is located at 6601 Silvery Ave, Las Vegas, NV 89108 and is currently estimated at $358,851, approximately $287 per square foot. 6601 Silvery Ave is a home located in Clark County with nearby schools including Berkeley L. Bunker Elementary School, Irwin & Susan Molasky Junior High School, and Cimarron Memorial High School.
Ownership History
Date
Name
Owned For
Owner Type
Purchase Details
Closed on
Jan 12, 2010
Sold by
Federal Home Loan Mortgage Corporation
Bought by
Marroquin Robert A and Marroquin Ana D
Current Estimated Value
Home Financials for this Owner
Home Financials are based on the most recent Mortgage that was taken out on this home.
Original Mortgage
$98,188
Outstanding Balance
$63,577
Interest Rate
4.68%
Mortgage Type
FHA
Estimated Equity
$295,274
Purchase Details
Closed on
Aug 31, 2009
Sold by
Castro Winemer
Bought by
Federal Home Loan Mortgage Corporation
Purchase Details
Closed on
Oct 2, 2006
Sold by
Riley Michael E and Riley Eve Domenique
Bought by
Castro Winemer
Home Financials for this Owner
Home Financials are based on the most recent Mortgage that was taken out on this home.
Original Mortgage
$200,000
Interest Rate
6.5%
Mortgage Type
Unknown
Purchase Details
Closed on
Jan 28, 1999
Sold by
Jermine Lillian A Field
Bought by
Riley Michael and Riley Eve
Home Financials for this Owner
Home Financials are based on the most recent Mortgage that was taken out on this home.
Original Mortgage
$88,800
Interest Rate
6.63%
Create a Home Valuation Report for This Property
The Home Valuation Report is an in-depth analysis detailing your home's value as well as a comparison with similar homes in the area
Home Values in the Area
Average Home Value in this Area
Purchase History
| Date | Buyer | Sale Price | Title Company |
|---|---|---|---|
| Marroquin Robert A | $100,000 | Fidelity National Title T | |
| Federal Home Loan Mortgage Corporation | $51,152 | None Available | |
| Castro Winemer | $250,000 | Title One | |
| Riley Michael | $111,000 | First American Title Co |
Source: Public Records
Mortgage History
| Date | Status | Borrower | Loan Amount |
|---|---|---|---|
| Open | Marroquin Robert A | $98,188 | |
| Previous Owner | Castro Winemer | $200,000 | |
| Previous Owner | Riley Michael | $88,800 |
Source: Public Records
Tax History Compared to Growth
Tax History
| Year | Tax Paid | Tax Assessment Tax Assessment Total Assessment is a certain percentage of the fair market value that is determined by local assessors to be the total taxable value of land and additions on the property. | Land | Improvement |
|---|---|---|---|---|
| 2025 | $1,155 | $67,017 | $26,250 | $40,767 |
| 2024 | $1,122 | $67,017 | $26,250 | $40,767 |
| 2023 | $1,122 | $64,345 | $26,600 | $37,745 |
| 2022 | $1,089 | $56,403 | $21,700 | $34,703 |
| 2021 | $1,058 | $53,503 | $20,300 | $33,203 |
| 2020 | $1,024 | $52,735 | $19,600 | $33,135 |
| 2019 | $994 | $49,708 | $16,800 | $32,908 |
| 2018 | $965 | $45,126 | $13,300 | $31,826 |
| 2017 | $915 | $44,946 | $12,600 | $32,346 |
| 2016 | $915 | $43,676 | $10,850 | $32,826 |
| 2015 | $912 | $37,969 | $7,000 | $30,969 |
| 2014 | $886 | $26,208 | $5,600 | $20,608 |
Source: Public Records
Map
Nearby Homes
- 6612 Old Newbury Ave
- 6544 Old Oxford Ave
- 6536 Castor Tree Way
- 2764 Trotwood Ln
- 6612 Gentle Winds Ct
- 6673 Silver Penny Ave
- 6428 Yarmouth Dr
- 6632 Light Breeze Dr
- 2700 N Rainbow Blvd Unit 1105
- 2700 N Rainbow Blvd Unit 1137
- 2801 N Rainbow Blvd Unit 103
- 2801 N Rainbow Blvd Unit 273
- 2801 N Rainbow Blvd Unit 252
- 2801 N Rainbow Blvd Unit 112
- 2912 Drury St
- 3100 Garehime St
- 6561 Avon Ct
- 6632 Coastal Breeze Ct
- 2532 Goldenmoon St
- 2624 Shakespeare Rd
- 6609 Silvery Ave Unit 3
- 6600 Old Newbury Ave
- 6604 Old Newbury Ave Unit III
- 2820 Old Sterling St
- 2820 Old Sterling St Unit na
- 6608 Old Newbury Ave
- 2824 Old Sterling St
- 6604 Silvery Ave
- 6600 Silvery Ave
- 2816 Old Sterling St
- 6613 Silvery Ave
- 6608 Silvery Ave
- 6528 Contessing Way
- 2812 Old Sterling St
- 6612 Silvery Ave Unit III
- 2828 Old Sterling St
- 6616 Old Newbury Ave
- 6601 Sterling Springs Pw Pkwy
- 6621 Silvery Ave
- 6601 Sterling Springs Pkwy