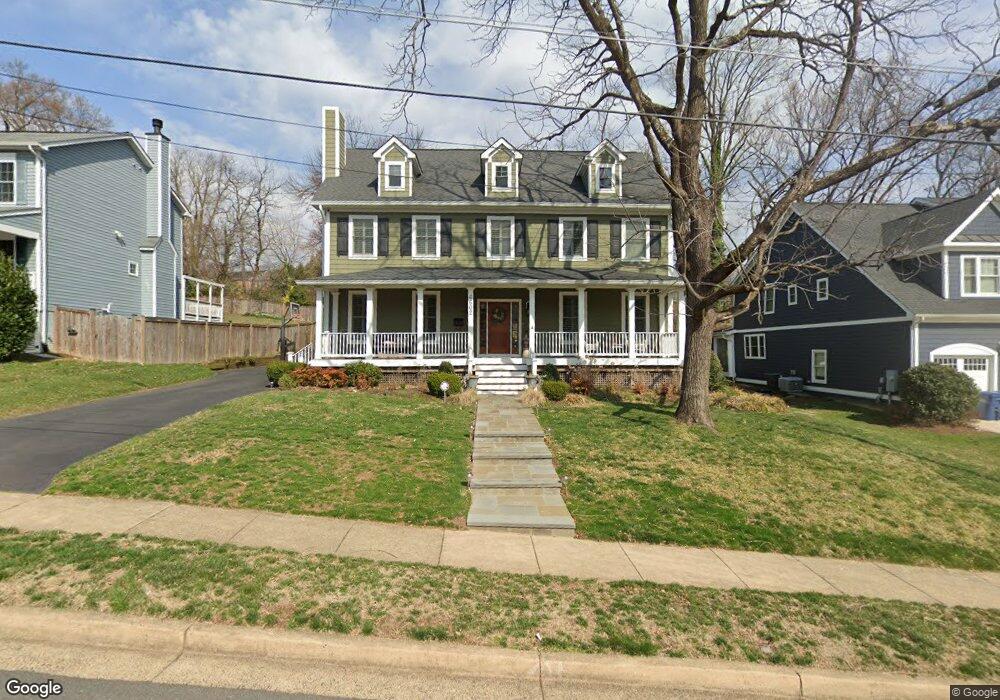
6602 Rockmont Ct Falls Church, VA 22043
Estimated Value: $2,032,640 - $2,446,000
5
Beds
6
Baths
5,324
Sq Ft
$421/Sq Ft
Est. Value
About This Home
This home is located at 6602 Rockmont Ct, Falls Church, VA 22043 and is currently estimated at $2,238,910, approximately $420 per square foot. 6602 Rockmont Ct is a home located in Fairfax County with nearby schools including Haycock Elementary School, Longfellow Middle School, and St. James Catholic School.
Ownership History
Date
Name
Owned For
Owner Type
Purchase Details
Closed on
Aug 31, 2009
Sold by
835 Elden Street Llc
Bought by
Cillizza Christopher
Current Estimated Value
Home Financials for this Owner
Home Financials are based on the most recent Mortgage that was taken out on this home.
Original Mortgage
$729,750
Outstanding Balance
$476,769
Interest Rate
5.17%
Mortgage Type
New Conventional
Estimated Equity
$1,762,141
Create a Home Valuation Report for This Property
The Home Valuation Report is an in-depth analysis detailing your home's value as well as a comparison with similar homes in the area
Home Values in the Area
Average Home Value in this Area
Purchase History
| Date | Buyer | Sale Price | Title Company |
|---|---|---|---|
| Cillizza Christopher | $1,175,000 | -- |
Source: Public Records
Mortgage History
| Date | Status | Borrower | Loan Amount |
|---|---|---|---|
| Open | Cillizza Christopher | $729,750 |
Source: Public Records
Tax History Compared to Growth
Tax History
| Year | Tax Paid | Tax Assessment Tax Assessment Total Assessment is a certain percentage of the fair market value that is determined by local assessors to be the total taxable value of land and additions on the property. | Land | Improvement |
|---|---|---|---|---|
| 2025 | $19,738 | $1,681,120 | $623,000 | $1,058,120 |
| 2024 | $19,738 | $1,623,640 | $623,000 | $1,000,640 |
| 2023 | $17,080 | $1,440,730 | $501,000 | $939,730 |
| 2022 | $16,325 | $1,358,740 | $442,000 | $916,740 |
| 2021 | $15,474 | $1,293,260 | $442,000 | $851,260 |
| 2020 | $14,923 | $1,236,870 | $433,000 | $803,870 |
| 2019 | $14,881 | $1,233,410 | $433,000 | $800,410 |
| 2018 | $13,468 | $1,171,100 | $416,000 | $755,100 |
| 2017 | $13,717 | $1,158,520 | $414,000 | $744,520 |
| 2016 | $13,601 | $1,151,150 | $414,000 | $737,150 |
| 2015 | $12,884 | $1,131,150 | $394,000 | $737,150 |
| 2014 | $12,139 | $1,068,090 | $386,000 | $682,090 |
Source: Public Records
Map
Nearby Homes
- 6607 Midhill Place
- 6609 Rockmont Ct
- 6610 Quinten St
- 2005 Highboro Way
- 6616 Kirby Ct
- 6545 Placid St
- 2125 Hilltop Place
- 1904 Lamson Place
- 6449 Orland St
- 6511 Ivy Hill Dr
- 2115 Natahoa Ct
- 2123 Natahoa Ct
- 2221 Orchid Dr
- 6613 Chesterfield Ave
- 6616 Fisher Ave
- 6613 Fisher Ave
- 2107 Elliott Ave
- 2231 N Tuckahoe St
- 6601 Gordon Ave
- 2136 Powhatan St
- 6604 Rockmont Ct
- 6600 Rockmont Ct
- 2040 Haycock Rd
- 6606 Rockmont Ct
- 6605 Midhill Place
- 6603 Midhill Place
- 6601 Midhill Place
- 6600 Midhill Place
- 6601 Rockmont Ct
- 6602 Midhill Place
- 6604 Midhill Place
- 6609 Midhill Place
- 6608 Rockmont Ct
- 6606 Midhill Place
- 2041 Haycock Rd
- 6605 Rockmont Ct
- 6611 Midhill Place
- 6608 Midhill Place
- 2043 Haycock Rd
- 0 Haycock Unit 1004242818