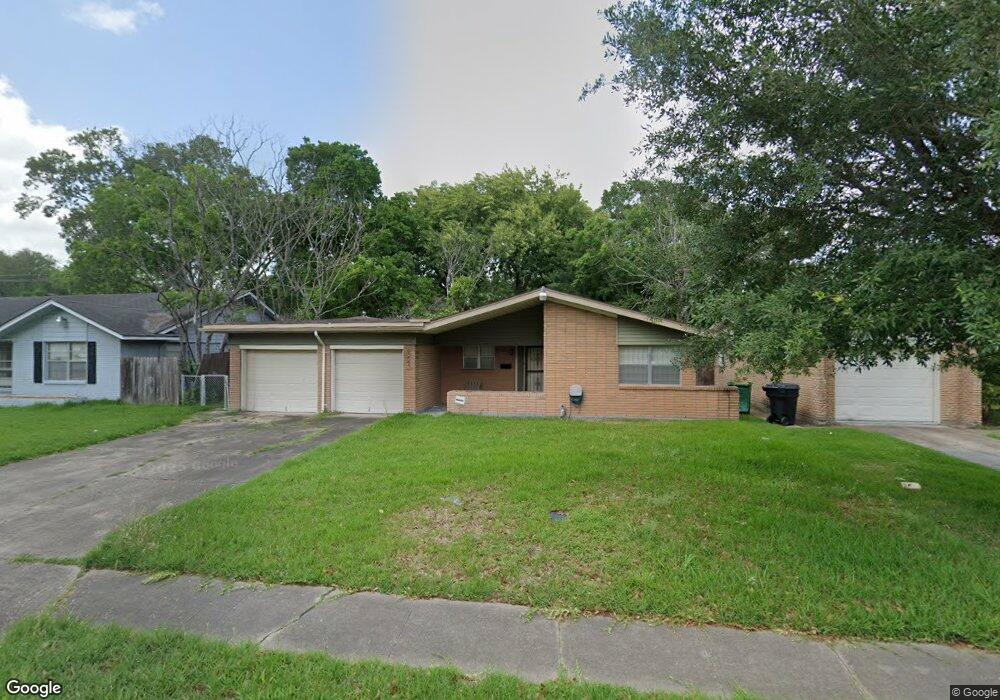
6602 Sharpview Dr Houston, TX 77074
Sharpstown NeighborhoodEstimated Value: $213,000 - $240,000
3
Beds
2
Baths
1,259
Sq Ft
$177/Sq Ft
Est. Value
About This Home
This home is located at 6602 Sharpview Dr, Houston, TX 77074 and is currently estimated at $222,231, approximately $176 per square foot. 6602 Sharpview Dr is a home located in Harris County with nearby schools including Sutton Elementary School, Long Academy, and Sharpstown High School.
Ownership History
Date
Name
Owned For
Owner Type
Purchase Details
Closed on
Dec 8, 2010
Sold by
Martinez Ruben and Martinez Vanessa
Bought by
Stroud Michael G
Current Estimated Value
Purchase Details
Closed on
Jun 16, 2008
Sold by
Montecelo Eduardo D
Bought by
Martinez Ruben and Martinez Vanessa
Home Financials for this Owner
Home Financials are based on the most recent Mortgage that was taken out on this home.
Original Mortgage
$99,810
Interest Rate
6.05%
Mortgage Type
Purchase Money Mortgage
Purchase Details
Closed on
Apr 19, 2006
Sold by
Montecelo Aurora Del Alba
Bought by
Montecelo Eduardo D
Purchase Details
Closed on
Nov 29, 1993
Sold by
Calloway Helen Catherine
Bought by
Montecelo Eduardo D and Montecelo Aurora Delalba
Home Financials for this Owner
Home Financials are based on the most recent Mortgage that was taken out on this home.
Original Mortgage
$52,505
Interest Rate
6.71%
Create a Home Valuation Report for This Property
The Home Valuation Report is an in-depth analysis detailing your home's value as well as a comparison with similar homes in the area
Home Values in the Area
Average Home Value in this Area
Purchase History
| Date | Buyer | Sale Price | Title Company |
|---|---|---|---|
| Stroud Michael G | -- | None Available | |
| Martinez Ruben | -- | Ameripoint Title | |
| Montecelo Eduardo D | -- | None Available | |
| Montecelo Eduardo D | -- | -- |
Source: Public Records
Mortgage History
| Date | Status | Borrower | Loan Amount |
|---|---|---|---|
| Previous Owner | Martinez Ruben | $99,810 | |
| Previous Owner | Montecelo Eduardo D | $52,505 |
Source: Public Records
Tax History
| Year | Tax Paid | Tax Assessment Tax Assessment Total Assessment is a certain percentage of the fair market value that is determined by local assessors to be the total taxable value of land and additions on the property. | Land | Improvement |
|---|---|---|---|---|
| 2025 | $4,537 | $216,845 | $108,000 | $108,845 |
| 2024 | $4,537 | $216,845 | $108,000 | $108,845 |
| 2023 | $4,537 | $212,366 | $108,000 | $104,366 |
| 2022 | $4,151 | $181,912 | $88,200 | $93,712 |
| 2021 | $3,522 | $151,132 | $61,200 | $89,932 |
| 2020 | $3,555 | $142,091 | $61,200 | $80,891 |
| 2019 | $4,136 | $158,439 | $61,200 | $97,239 |
| 2018 | $3,726 | $147,264 | $48,600 | $98,664 |
| 2017 | $3,252 | $147,264 | $48,600 | $98,664 |
| 2016 | $2,957 | $136,877 | $48,600 | $88,277 |
| 2015 | $1,757 | $121,226 | $48,600 | $72,626 |
| 2014 | $1,757 | $93,677 | $28,800 | $64,877 |
Source: Public Records
Map
Nearby Homes
- 6536 Sharpview Dr
- 6510 Roos Rd
- 6609 Scribner Rd
- 8110 Albacore Dr Unit 38
- 8118 Albacore Dr Unit 7
- 6434 Leader St
- 6833 Concho St
- 7022 Triola Ln
- 6938 Mobud Dr
- 6834 Leader St
- 7031 Triola Ln
- 7031 Neff St
- 7014 Concho St
- 7102 Sharpview Dr
- 7043 Carvel Ln
- 6017 Cypress St
- 6647 De Moss Dr Unit 647
- 6031 Cypress St
- 6122 Jessamine St
- 5671 Sylmar Rd
- 6606 Sharpview Dr
- 6601 Stroud Dr
- 6530 Sharpview Dr
- 6533 Stroud Dr
- 6610 Sharpview Dr
- 6605 Stroud Dr
- 6529 Stroud Dr
- 6601 Sharpview Dr
- 6602 Sandstone St
- 6526 Sharpview Dr
- 6614 Sharpview Dr
- 6609 Stroud Dr
- 6525 Stroud Dr
- 6610 Sandstone St
- 6609 Sharpview Dr
- 6613 Stroud Dr
- 6522 Sharpview Dr
- 6618 Sharpview Dr
- 6622 Sandstone St
- 6521 Stroud Dr
Your Personal Tour Guide
Ask me questions while you tour the home.