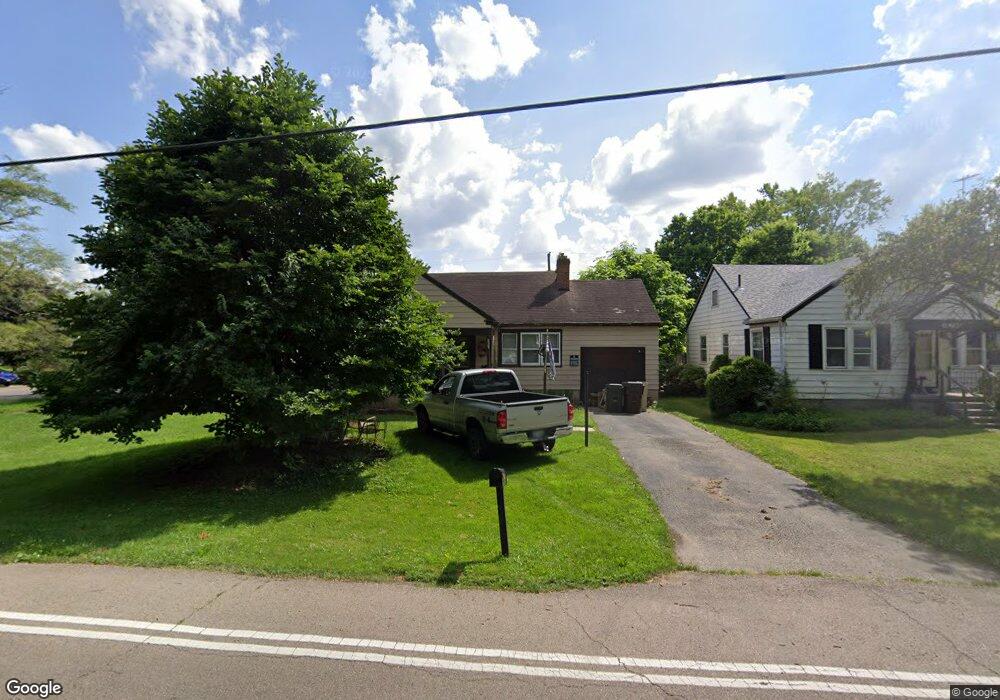
6602 Wolf Creek Pike Dayton, OH 45426
Estimated Value: $134,561 - $174,000
3
Beds
2
Baths
1,532
Sq Ft
$101/Sq Ft
Est. Value
About This Home
This home is located at 6602 Wolf Creek Pike, Dayton, OH 45426 and is currently estimated at $154,140, approximately $100 per square foot. 6602 Wolf Creek Pike is a home located in Montgomery County with nearby schools including Trotwood-Madison Middle School, Trotwood-Madison High School, and Trotwood Preparatory & Fitness Academy.
Ownership History
Date
Name
Owned For
Owner Type
Purchase Details
Closed on
Apr 25, 2019
Sold by
Dsv Spv2 Llc
Bought by
Miller Randall S
Current Estimated Value
Purchase Details
Closed on
Jul 18, 2017
Sold by
Kaja Holdings Llc
Bought by
Dsv Spv2 Llc
Purchase Details
Closed on
Sep 26, 2013
Sold by
Deutsche Bank National Trust Co
Bought by
Kaja Holdings Llc
Purchase Details
Closed on
Feb 6, 2013
Sold by
Swisher Julie A
Bought by
Deutsche Bank National Trust Co
Purchase Details
Closed on
May 31, 2001
Sold by
Quillen Donald S
Bought by
Swisher Tom and Swisher Julie A
Home Financials for this Owner
Home Financials are based on the most recent Mortgage that was taken out on this home.
Original Mortgage
$52,640
Interest Rate
11.05%
Mortgage Type
Purchase Money Mortgage
Create a Home Valuation Report for This Property
The Home Valuation Report is an in-depth analysis detailing your home's value as well as a comparison with similar homes in the area
Home Values in the Area
Average Home Value in this Area
Purchase History
| Date | Buyer | Sale Price | Title Company |
|---|---|---|---|
| Miller Randall S | $22,900 | Partners Land Title Agency | |
| Dsv Spv2 Llc | $47,400 | None Available | |
| Kaja Holdings Llc | $11,700 | None Available | |
| Deutsche Bank National Trust Co | $26,000 | None Available | |
| Swisher Tom | $65,800 | -- |
Source: Public Records
Mortgage History
| Date | Status | Borrower | Loan Amount |
|---|---|---|---|
| Previous Owner | Swisher Tom | $52,640 |
Source: Public Records
Tax History Compared to Growth
Tax History
| Year | Tax Paid | Tax Assessment Tax Assessment Total Assessment is a certain percentage of the fair market value that is determined by local assessors to be the total taxable value of land and additions on the property. | Land | Improvement |
|---|---|---|---|---|
| 2024 | $1,071 | $16,310 | $3,270 | $13,040 |
| 2023 | $1,071 | $16,310 | $3,270 | $13,040 |
| 2022 | $1,104 | $12,770 | $2,560 | $10,210 |
| 2021 | $1,106 | $12,770 | $2,560 | $10,210 |
| 2020 | $1,104 | $12,770 | $2,560 | $10,210 |
| 2019 | $1,412 | $14,670 | $1,790 | $12,880 |
| 2018 | $2,808 | $14,670 | $1,790 | $12,880 |
| 2017 | $1,405 | $14,670 | $1,790 | $12,880 |
| 2016 | $1,467 | $15,320 | $2,560 | $12,760 |
| 2015 | $1,539 | $15,320 | $2,560 | $12,760 |
| 2014 | $1,539 | $15,320 | $2,560 | $12,760 |
| 2012 | -- | $25,760 | $4,380 | $21,380 |
Source: Public Records
Map
Nearby Homes
- 33 Mario Dr
- 204 E Main St
- 4 Pleasant Ave
- 301 Beardsley Rd
- 103 E Worley Ave
- 1 E Worley Ave
- 208 E Sunrise Ave
- 17 Grand Ave
- 385 Blairwood Dr
- 0 Main
- 209 W Main St
- 717 Mapleside Dr
- 208 E Eppington Dr
- 800 Chandler Dr
- 512 N Sherry Dr
- 7540 Tuscola Dr
- 316 Skinner Dr
- 4051 Belmore Trace
- 825 Fairgrove Way
- 6899 Little Richmond Rd
- 1 George St
- 6588 Wolf Creek Pike
- 6608 Wolf Creek Pike
- 6616 Wolf Creek Pike
- 23 Rio Grande Ave
- 6562 Wolf Creek Pike
- 2 George St
- 6607 Wolf Creek Pike
- 25 Rio Grande Ave
- 6589 Wolf Creek Pike
- 21 Rio Grande Ave
- 6550 Wolf Creek Pike
- 101 Rio Grande Ave
- 19 Rio Grande Ave
- 6628 Wolf Creek Pike
- 103 Rio Grande Ave
- 6538 Wolf Creek Pike
- 17 Rio Grande Ave
- 105 Rio Grande Ave
- 26 Rio Grande Ave