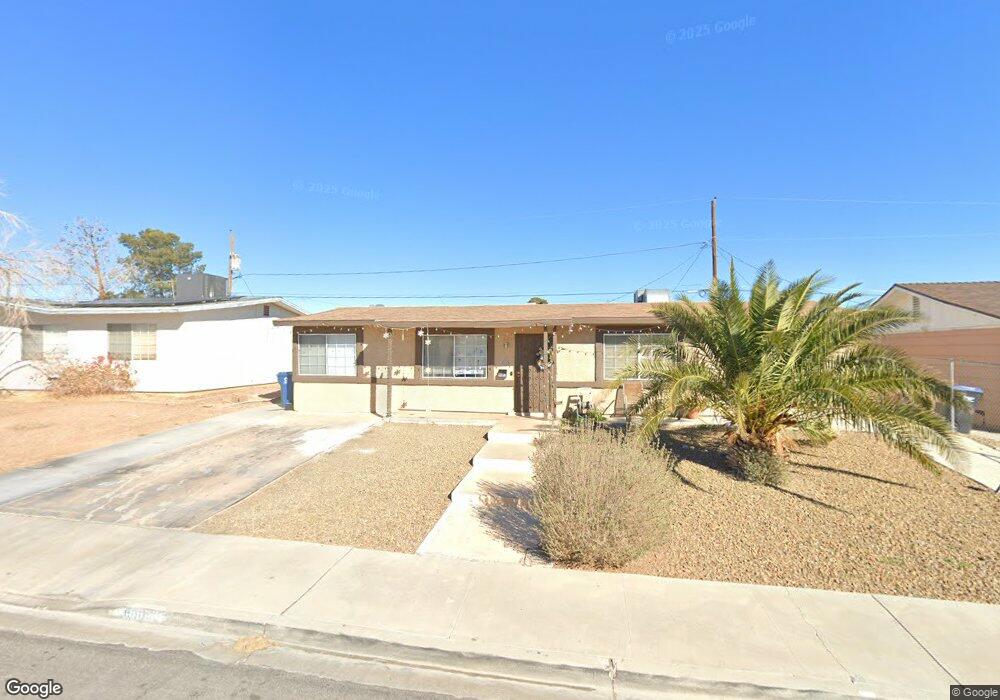
6604 Brandywine Way Las Vegas, NV 89107
Charleston Preservation NeighborhoodEstimated Value: $298,703 - $338,000
3
Beds
1
Bath
988
Sq Ft
$317/Sq Ft
Est. Value
About This Home
This home is located at 6604 Brandywine Way, Las Vegas, NV 89107 and is currently estimated at $313,176, approximately $316 per square foot. 6604 Brandywine Way is a home located in Clark County with nearby schools including Rose Warren Elementary School, Frank F Garside Junior High School, and Bonanza High School.
Ownership History
Date
Name
Owned For
Owner Type
Purchase Details
Closed on
Apr 29, 2009
Sold by
Villa Luis C and Villagamero Patricia
Bought by
Us Bank Na
Current Estimated Value
Purchase Details
Closed on
Jul 16, 2007
Sold by
Us Bank Na
Bought by
Gmet Property Acquisitions Llc
Purchase Details
Closed on
Oct 4, 2005
Sold by
Grauberger Verle and Grauberger Darla Kay
Bought by
Villa Luis C and Villagamero Patricia
Home Financials for this Owner
Home Financials are based on the most recent Mortgage that was taken out on this home.
Original Mortgage
$163,960
Interest Rate
6.8%
Mortgage Type
Balloon
Purchase Details
Closed on
May 2, 2000
Sold by
Grauberger Verle R and Grauberger Darla Kay
Bought by
Grauberger Verle R and Grauberger Darla Kay
Purchase Details
Closed on
Dec 1, 1995
Sold by
Holloway Walter Bruce and Holloway Diana L
Bought by
Grauberger Verle R and Grauberger Darla Kay
Create a Home Valuation Report for This Property
The Home Valuation Report is an in-depth analysis detailing your home's value as well as a comparison with similar homes in the area
Home Values in the Area
Average Home Value in this Area
Purchase History
| Date | Buyer | Sale Price | Title Company |
|---|---|---|---|
| Us Bank Na | $60,000 | Fidelity National Default So | |
| Gmet Property Acquisitions Llc | $45,000 | Chicago Title Las Vegas | |
| Villa Luis C | $204,950 | Ticor Title Of Nevada Inc | |
| Grauberger Verle | -- | Ticor Title Of Nevada Inc | |
| Grauberger Verle R | -- | -- | |
| Grauberger Verle R | $16,000 | -- |
Source: Public Records
Mortgage History
| Date | Status | Borrower | Loan Amount |
|---|---|---|---|
| Previous Owner | Villa Luis C | $163,960 |
Source: Public Records
Tax History Compared to Growth
Tax History
| Year | Tax Paid | Tax Assessment Tax Assessment Total Assessment is a certain percentage of the fair market value that is determined by local assessors to be the total taxable value of land and additions on the property. | Land | Improvement |
|---|---|---|---|---|
| 2025 | $666 | $44,444 | $30,800 | $13,644 |
| 2024 | $647 | $44,444 | $30,800 | $13,644 |
| 2023 | $678 | $42,819 | $30,450 | $12,369 |
| 2022 | $659 | $36,219 | $25,200 | $11,019 |
| 2021 | $610 | $33,712 | $23,450 | $10,262 |
| 2020 | $564 | $29,588 | $19,600 | $9,988 |
| 2019 | $528 | $27,110 | $17,500 | $9,610 |
| 2018 | $504 | $23,729 | $14,700 | $9,029 |
| 2017 | $752 | $22,950 | $14,000 | $8,950 |
| 2016 | $473 | $18,788 | $10,150 | $8,638 |
| 2015 | $471 | $16,079 | $7,700 | $8,379 |
| 2014 | $456 | $13,501 | $5,250 | $8,251 |
Source: Public Records
Map
Nearby Homes
- 6612 Burgundy Way
- 6508 Bourbon Way
- 421 Courtney Ln
- 408 Greenfield Ln
- 404 Vassar Ln
- 6701 Theus Cir
- 325 Greenfield Ln
- 416 Lindy Dr
- 6709 Theus Cir
- 6449 Alta Dr
- 321 Bent Creek Dr
- 6457 Celeste Ave
- 6741 Chehalis Cir
- 6444 Bannock Way
- 6628 Celeste Ave
- 6416 Alta Dr
- 6409 Burgundy Way
- 6432 Bannock Way
- 6420 Evergreen Ave
- 6412 Bristol Way
- 6600 Brandywine Way
- 6605 Burgundy Way
- 6601 Burgundy Way Unit D1
- 6612 Brandywine Way
- 6609 Burgundy Way
- 6605 Brandywine Way
- 6601 Brandywine Way
- 6609 Brandywine Way
- 6609 Brandywine Way Unit n/a
- 6613 Burgundy Way
- 6616 Brandywine Way
- 6560 Brandywine Way
- 6613 Brandywine Way
- 6561 Burgundy Way
- 6617 Burgundy Way Unit 27D1
- 6561 Brandywine Way
- 6617 Brandywine Way
- 6620 Brandywine Way
- 6604 Bourbon Way