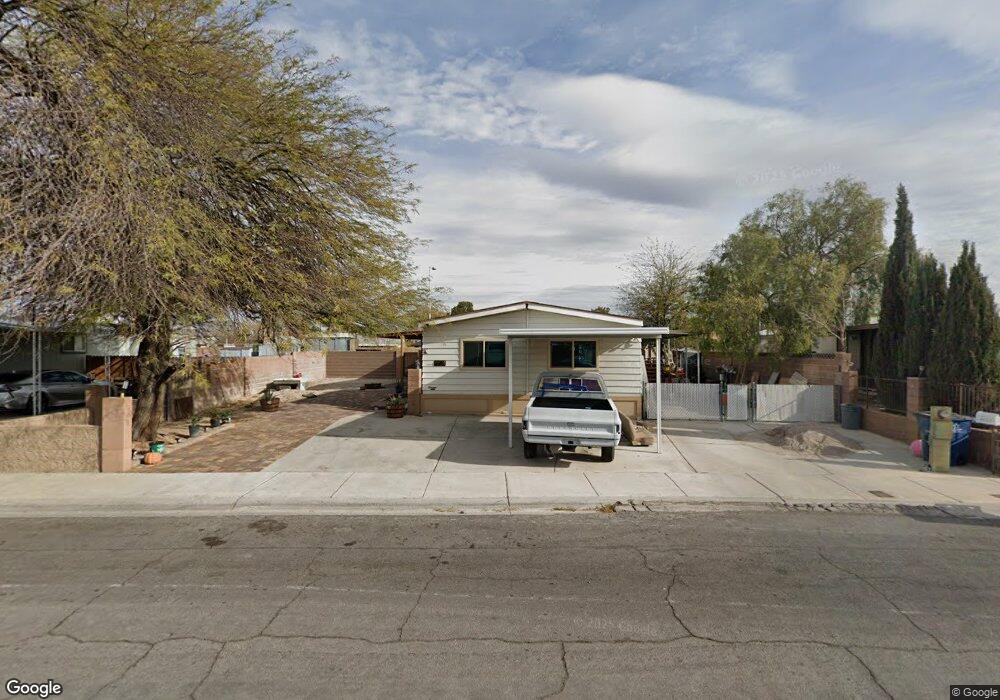
6604 Plumflower Ln Las Vegas, NV 89108
Woodcrest NeighborhoodEstimated Value: $262,000 - $295,000
3
Beds
2
Baths
1,440
Sq Ft
$192/Sq Ft
Est. Value
About This Home
This home is located at 6604 Plumflower Ln, Las Vegas, NV 89108 and is currently estimated at $276,667, approximately $192 per square foot. 6604 Plumflower Ln is a home located in Clark County with nearby schools including Ruthe Deskin Elementary School, Justice Myron E Leavitt Middle School, and Centennial High School.
Ownership History
Date
Name
Owned For
Owner Type
Purchase Details
Closed on
Jun 15, 2021
Sold by
Ortiz Ernesto and Ortiz Laura
Bought by
Ortiz Ernesto
Current Estimated Value
Purchase Details
Closed on
Nov 16, 2011
Sold by
Secretary Of Housing & Urban Development
Bought by
Ortiz Ernesto and Ortiz Laura
Purchase Details
Closed on
Jul 16, 2010
Sold by
Wells Fargo Bank Na
Bought by
Secretary Of Housing & Urban Development
Purchase Details
Closed on
Oct 29, 2004
Sold by
Savage Peter H and Savage Lillian T
Bought by
Price Malik
Home Financials for this Owner
Home Financials are based on the most recent Mortgage that was taken out on this home.
Original Mortgage
$127,991
Interest Rate
5.74%
Mortgage Type
FHA
Create a Home Valuation Report for This Property
The Home Valuation Report is an in-depth analysis detailing your home's value as well as a comparison with similar homes in the area
Home Values in the Area
Average Home Value in this Area
Purchase History
| Date | Buyer | Sale Price | Title Company |
|---|---|---|---|
| Ortiz Ernesto | -- | None Listed On Document | |
| Ortiz Ernesto | $30,800 | Nevada Title Las Vegas | |
| Secretary Of Housing & Urban Development | $151,654 | Fidelity National Default S | |
| Wells Fargo Bank Na | $151,654 | Fidelity National Default S | |
| Price Malik | $130,000 | Chicago Title |
Source: Public Records
Mortgage History
| Date | Status | Borrower | Loan Amount |
|---|---|---|---|
| Previous Owner | Price Malik | $127,991 |
Source: Public Records
Tax History Compared to Growth
Tax History
| Year | Tax Paid | Tax Assessment Tax Assessment Total Assessment is a certain percentage of the fair market value that is determined by local assessors to be the total taxable value of land and additions on the property. | Land | Improvement |
|---|---|---|---|---|
| 2025 | $666 | $36,148 | $18,200 | $17,948 |
| 2024 | $1,815 | $36,148 | $18,200 | $17,948 |
| 2023 | $1,815 | $35,013 | $17,500 | $17,513 |
| 2022 | $492 | $30,202 | $14,000 | $16,202 |
| 2021 | $478 | $27,936 | $12,250 | $15,686 |
| 2020 | $461 | $26,353 | $10,500 | $15,853 |
| 2019 | $448 | $22,922 | $7,000 | $15,922 |
| 2018 | $435 | $22,564 | $7,000 | $15,564 |
| 2017 | $757 | $23,083 | $7,000 | $16,083 |
| 2016 | $413 | $17,045 | $5,950 | $11,095 |
| 2015 | $658 | $12,130 | $5,250 | $6,880 |
| 2014 | $713 | $12,160 | $5,250 | $6,910 |
Source: Public Records
Map
Nearby Homes
- 6521 Faith Peak Dr
- 6628 Plumflower Ln
- 6508 Faith Peak Dr
- 6802 W Craig Rd
- 5031 N Rainbow Blvd Unit 110
- 4252 Orangeblossom St
- 6633 Wheelbarrow Peak Dr
- 6421 Doby Peak Dr
- 4229 Jadestone Ave
- 6425 Wheelbarrow Peak Dr
- 6732 Accent Ct
- 6741 Accent Ct
- 6608 Messenger Ct
- 4232 Orangeblossom Ct
- 6636 Painted Desert Dr
- 6900 Quail Hollow Dr
- 4217 Jasper Ave
- 4113 Compass Rose Way
- 6429 Roy Rogers Dr Unit 2
- 5774 Smithsonian Way
- 6608 Plumflower Ln
- 6600 Plumflower Ln
- 6612 Plumflower Ln
- 6601 Plumflower Ln
- 6616 Plumflower Ln
- 4328 Zinnia Ln
- 6613 Plumflower Ln
- 6529 Faith Peak Dr
- 6525 Faith Peak Dr
- 6533 Faith Peak Dr
- 6600 Pearblossom Ln
- 6604 Pearblossom Ln
- 6620 Plumflower Ln
- 4324 Zinnia Ln
- 6617 Plumflower Ln
- 6537 Faith Peak Dr
- 6517 Faith Peak Dr Unit 1
- 6501 Zinnia Ct
- 4313 Carnation Ln
- 6541 Faith Peak Dr