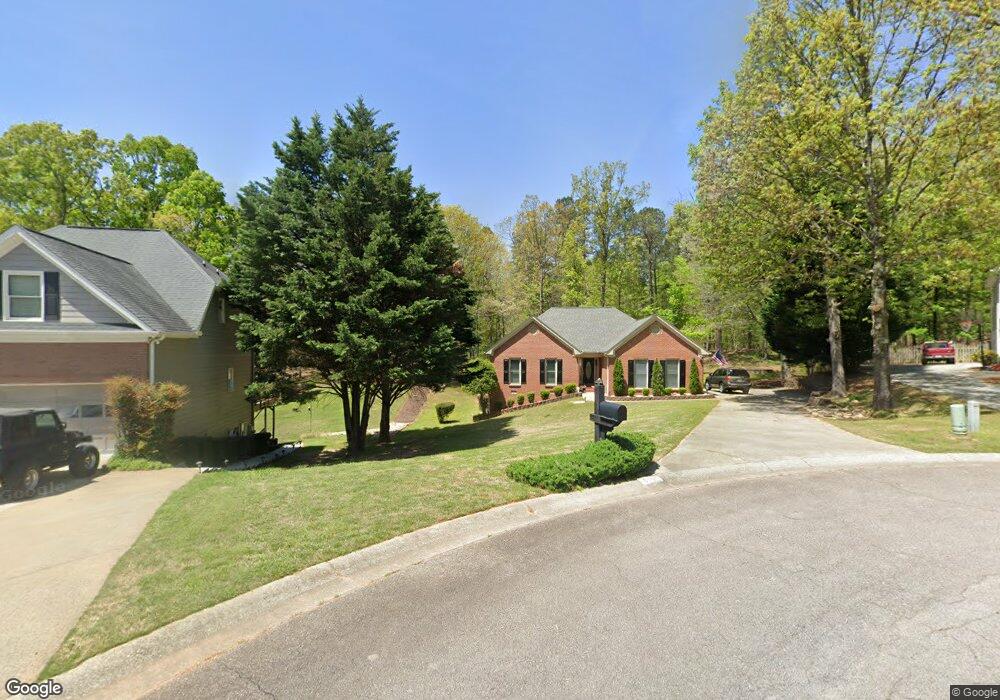
6605 Firelight Ln Flowery Branch, GA 30542
Estimated Value: $346,858 - $423,000
3
Beds
2
Baths
1,488
Sq Ft
$257/Sq Ft
Est. Value
About This Home
This home is located at 6605 Firelight Ln, Flowery Branch, GA 30542 and is currently estimated at $381,965, approximately $256 per square foot. 6605 Firelight Ln is a home located in Hall County with nearby schools including Flowery Branch Elementary School, West Hall Middle School, and West Hall High School.
Ownership History
Date
Name
Owned For
Owner Type
Purchase Details
Closed on
Jul 25, 2006
Sold by
Correa Edward
Bought by
Correa Wanda
Current Estimated Value
Purchase Details
Closed on
Sep 4, 1998
Sold by
Burgess Gary and Burgess Sharon
Bought by
Correra Edward and Correra Wanda
Home Financials for this Owner
Home Financials are based on the most recent Mortgage that was taken out on this home.
Original Mortgage
$173,050
Interest Rate
6.99%
Mortgage Type
New Conventional
Purchase Details
Closed on
May 31, 1996
Sold by
Crews Brayan M Alicia
Bought by
Burgess Gary R Sharon L
Purchase Details
Closed on
Oct 18, 1993
Sold by
Henderson Jeff
Bought by
Crews Bryan M and Crews Alicia
Home Financials for this Owner
Home Financials are based on the most recent Mortgage that was taken out on this home.
Original Mortgage
$84,500
Interest Rate
7.07%
Purchase Details
Closed on
Jul 1, 1993
Create a Home Valuation Report for This Property
The Home Valuation Report is an in-depth analysis detailing your home's value as well as a comparison with similar homes in the area
Home Values in the Area
Average Home Value in this Area
Purchase History
| Date | Buyer | Sale Price | Title Company |
|---|---|---|---|
| Correa Wanda | -- | -- | |
| Correra Edward | $1,190,003 | -- | |
| Correa Edward | $119,000 | -- | |
| Burgess Gary R Sharon L | $115,000 | -- | |
| Crews Bryan M | $94,500 | -- | |
| -- | $35,000 | -- |
Source: Public Records
Mortgage History
| Date | Status | Borrower | Loan Amount |
|---|---|---|---|
| Previous Owner | Correa Edward | $173,050 | |
| Previous Owner | Crews Bryan M | $84,500 | |
| Closed | Burgess Gary R Sharon L | $0 |
Source: Public Records
Tax History Compared to Growth
Tax History
| Year | Tax Paid | Tax Assessment Tax Assessment Total Assessment is a certain percentage of the fair market value that is determined by local assessors to be the total taxable value of land and additions on the property. | Land | Improvement |
|---|---|---|---|---|
| 2024 | $2,921 | $114,760 | $20,120 | $94,640 |
| 2023 | $2,364 | $108,280 | $20,120 | $88,160 |
| 2022 | $2,579 | $97,120 | $20,120 | $77,000 |
| 2021 | $2,009 | $73,680 | $10,040 | $63,640 |
| 2020 | $1,976 | $70,400 | $10,040 | $60,360 |
| 2019 | $1,870 | $66,040 | $10,040 | $56,000 |
| 2018 | $1,455 | $49,120 | $8,960 | $40,160 |
| 2017 | $1,321 | $44,840 | $8,960 | $35,880 |
| 2016 | $1,347 | $44,840 | $8,960 | $35,880 |
| 2015 | $1,221 | $44,840 | $8,960 | $35,880 |
| 2014 | $1,221 | $49,311 | $8,960 | $40,351 |
Source: Public Records
Map
Nearby Homes
- 6397 Snelling Mill Rd
- 6604 Windbrook Way
- 6398 Snelling Mill Rd
- 6708 Thornwood Ct
- 6732 Willowbrook Trail
- 6714 Corryton St
- SUDBURY 24' TOWNHOME Plan at Waypoint
- ADDINGTON Plan at Waypoint
- SALISBURY 24' TOWNHOME Plan at Waypoint
- AMESBURY Plan at Waypoint
- 6737 Leigh St
- 6745 Leigh St
- 6664 Parsons St
- 6740 Leigh St
- 6732 Leigh St
- 6610 Firelight Ln
- 6601 Firelight Ln
- 0 Firelight Dr Unit LOT 25 3100602
- Lot 25 Firelight Dr
- Lot 8 Firelight Dr
- 0 Firelight Ln Unit 3098636
- 0 Firelight Ln Unit 7342164
- 0 Firelight Ln
- 6606 Firelight Ln
- 6632 Lake Run Dr
- 6602 Firelight Ln Unit 6
- 6602 Firelight Ln
- 6636 Lake Run Dr
- 6620 Lake Run Dr
- 6574 McEver Rd
- 6640 Lake Run Dr
- 6625 Lake Run Dr
- 6637 Lake Run Dr
- 6616 Lake Run Dr
- 0 Lake Run Dr Unit 8716989