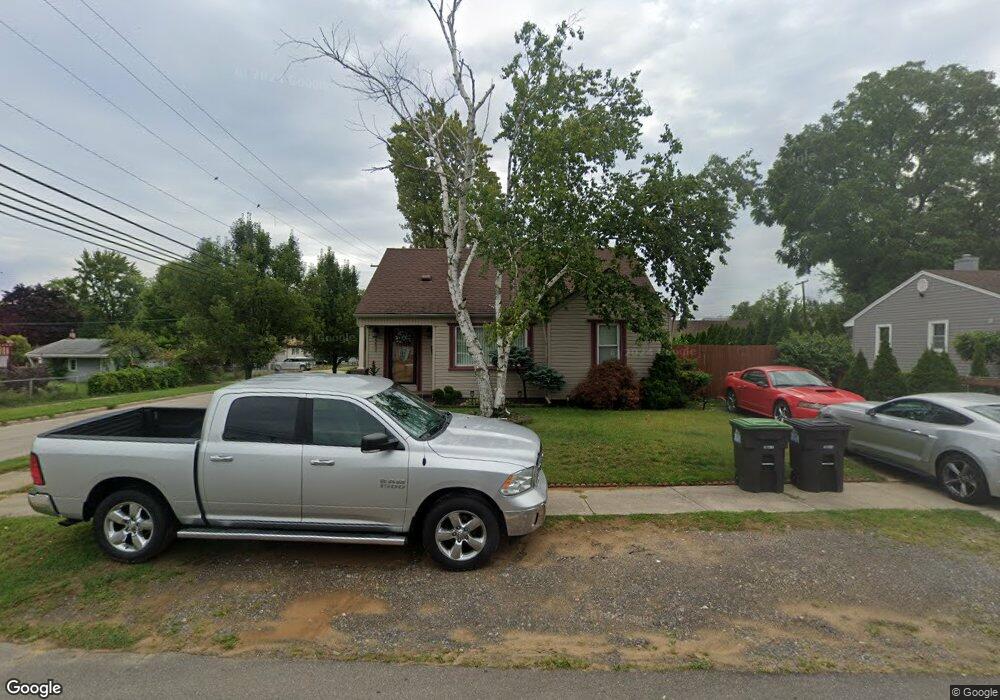
6607 Elm St Taylor, MI 48180
Estimated Value: $140,718 - $172,000
--
Bed
--
Bath
1,104
Sq Ft
$140/Sq Ft
Est. Value
About This Home
This home is located at 6607 Elm St, Taylor, MI 48180 and is currently estimated at $154,930, approximately $140 per square foot. 6607 Elm St is a home located in Wayne County with nearby schools including Clarence Randall Elementary School, Hoover Middle School, and Quest Charter Academy.
Ownership History
Date
Name
Owned For
Owner Type
Purchase Details
Closed on
Aug 27, 2007
Sold by
Mcintosh April A and Poteet Faye L
Bought by
Mcintosh April A
Current Estimated Value
Home Financials for this Owner
Home Financials are based on the most recent Mortgage that was taken out on this home.
Original Mortgage
$96,000
Outstanding Balance
$60,531
Interest Rate
6.49%
Mortgage Type
New Conventional
Estimated Equity
$94,399
Purchase Details
Closed on
Dec 19, 2001
Sold by
Kline Mary R
Bought by
Mcintosh April A
Create a Home Valuation Report for This Property
The Home Valuation Report is an in-depth analysis detailing your home's value as well as a comparison with similar homes in the area
Home Values in the Area
Average Home Value in this Area
Purchase History
| Date | Buyer | Sale Price | Title Company |
|---|---|---|---|
| Mcintosh April A | -- | Accommodation | |
| Mcintosh April A | $81,000 | -- |
Source: Public Records
Mortgage History
| Date | Status | Borrower | Loan Amount |
|---|---|---|---|
| Open | Mcintosh April A | $96,000 |
Source: Public Records
Tax History Compared to Growth
Tax History
| Year | Tax Paid | Tax Assessment Tax Assessment Total Assessment is a certain percentage of the fair market value that is determined by local assessors to be the total taxable value of land and additions on the property. | Land | Improvement |
|---|---|---|---|---|
| 2025 | $1,281 | $67,300 | $0 | $0 |
| 2024 | $1,281 | $59,200 | $0 | $0 |
| 2023 | $1,545 | $52,600 | $0 | $0 |
| 2022 | $1,222 | $46,800 | $0 | $0 |
| 2021 | $1,357 | $42,400 | $0 | $0 |
| 2020 | $1,344 | $37,700 | $0 | $0 |
| 2019 | $206,915 | $30,100 | $0 | $0 |
| 2018 | $1,049 | $24,500 | $0 | $0 |
| 2017 | $775 | $24,900 | $0 | $0 |
| 2016 | $2,095 | $24,300 | $0 | $0 |
| 2015 | $2,550 | $25,500 | $0 | $0 |
| 2013 | $2,580 | $26,600 | $0 | $0 |
| 2012 | $1,118 | $26,000 | $10,700 | $15,300 |
Source: Public Records
Map
Nearby Homes