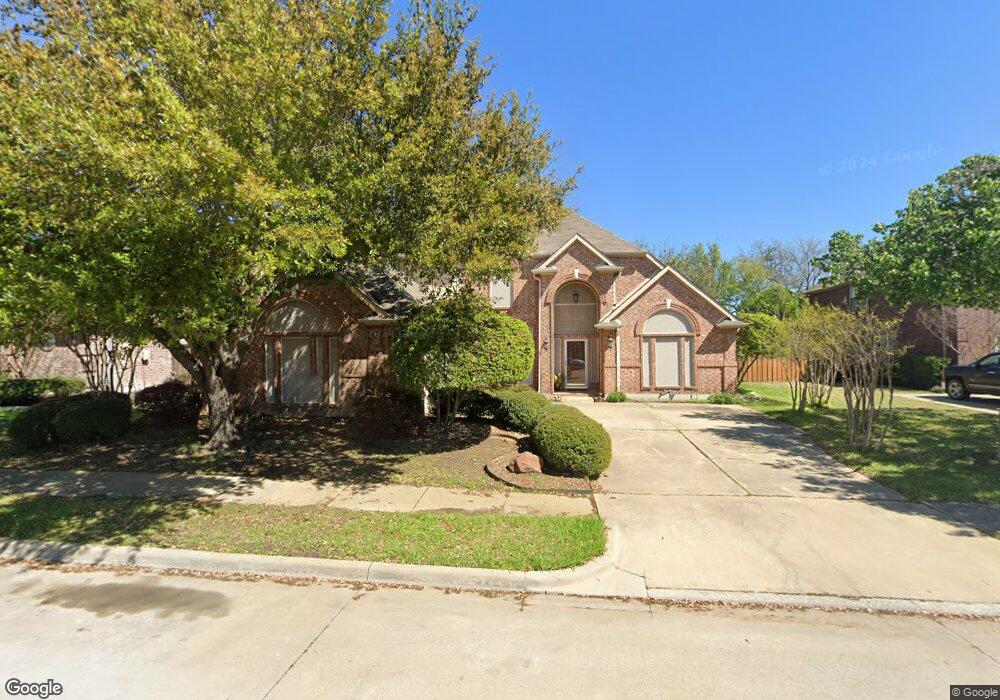
6608 Crestwood Ct Sachse, TX 75048
Estimated Value: $529,000 - $721,000
4
Beds
3
Baths
3,483
Sq Ft
$167/Sq Ft
Est. Value
About This Home
This home is located at 6608 Crestwood Ct, Sachse, TX 75048 and is currently estimated at $582,311, approximately $167 per square foot. 6608 Crestwood Ct is a home located in Dallas County with nearby schools including Pinnacle Montessori of Sachse.
Ownership History
Date
Name
Owned For
Owner Type
Purchase Details
Closed on
Jun 20, 2013
Sold by
Burdick Robert and Burdick Irene
Bought by
Golen Ramon and Golen Elouisa
Current Estimated Value
Home Financials for this Owner
Home Financials are based on the most recent Mortgage that was taken out on this home.
Original Mortgage
$256,319
Outstanding Balance
$181,842
Interest Rate
3.43%
Mortgage Type
New Conventional
Estimated Equity
$400,469
Purchase Details
Closed on
Sep 26, 2001
Sold by
Ray Morris Homes Inc
Bought by
Burdick Robert and Burdick Irene
Home Financials for this Owner
Home Financials are based on the most recent Mortgage that was taken out on this home.
Original Mortgage
$228,000
Interest Rate
6.88%
Purchase Details
Closed on
May 25, 2000
Sold by
Woodbridge Ii Ltd
Bought by
Ray Morris Homes Inc
Home Financials for this Owner
Home Financials are based on the most recent Mortgage that was taken out on this home.
Original Mortgage
$178,654
Interest Rate
8.13%
Create a Home Valuation Report for This Property
The Home Valuation Report is an in-depth analysis detailing your home's value as well as a comparison with similar homes in the area
Home Values in the Area
Average Home Value in this Area
Purchase History
| Date | Buyer | Sale Price | Title Company |
|---|---|---|---|
| Golen Ramon | -- | None Available | |
| Burdick Robert | -- | -- | |
| Ray Morris Homes Inc | -- | -- |
Source: Public Records
Mortgage History
| Date | Status | Borrower | Loan Amount |
|---|---|---|---|
| Open | Golen Ramon | $256,319 | |
| Previous Owner | Burdick Robert | $228,000 | |
| Previous Owner | Ray Morris Homes Inc | $178,654 |
Source: Public Records
Tax History Compared to Growth
Tax History
| Year | Tax Paid | Tax Assessment Tax Assessment Total Assessment is a certain percentage of the fair market value that is determined by local assessors to be the total taxable value of land and additions on the property. | Land | Improvement |
|---|---|---|---|---|
| 2025 | $9,217 | $527,160 | $110,000 | $417,160 |
| 2024 | $9,217 | $489,930 | $110,000 | $379,930 |
| 2023 | $9,217 | $510,340 | $110,000 | $400,340 |
| 2022 | $11,405 | $476,690 | $110,000 | $366,690 |
| 2021 | $9,330 | $362,550 | $40,000 | $322,550 |
| 2020 | $9,495 | $362,930 | $40,000 | $322,930 |
| 2019 | $10,295 | $362,930 | $40,000 | $322,930 |
| 2018 | $10,394 | $362,930 | $40,000 | $322,930 |
| 2017 | $8,886 | $309,410 | $40,000 | $269,410 |
| 2016 | $8,886 | $309,410 | $40,000 | $269,410 |
| 2015 | $7,271 | $273,300 | $36,000 | $237,300 |
| 2014 | $7,271 | $270,490 | $36,000 | $234,490 |
Source: Public Records
Map
Nearby Homes
- 6715 Highland Crest Ln
- 6004 Crestmill Ln
- 6322 Falcon Crest Ct
- 6106 Lakecrest Dr
- 5519 Bradford Estates Ct
- 6403 Highland Crest Ln
- 6211 Crestmont Ln
- 6209 Creek Crossing Ln
- 6325 Timbercrest Trail
- 5805 Meadowcrest Ln
- 6815 Holly Hills Ln
- 6104 Crestmoor Ln
- 7120 Hillshire Ln
- 6502 Lakecrest Dr
- 6921 Lakehurst Ln
- 6506 Lakecrest Dr
- 6524 Briar Lake Trail
- 6122 Fieldcrest Ln
- 6810 Bailey Rd
- 6521 Hillview Ln
- 6604 Crestwood Ct
- 6612 Crestwood Ct
- 6611 Highland Crest Ln
- 6605 Highland Crest Ln
- 6703 Highland Crest Ln
- 5915 Holly Crest Ln
- 6616 Crestwood Ct
- 6709 Highland Crest Ln
- 6609 Crestwood Ct
- 6533 Highland Crest Ln
- 5922 Holly Crest Ln
- 5918 Holly Crest Ln
- 6617 Crestwood Ct
- 5911 Holly Crest Ln
- 6611 Crestwood Ct
- 5914 Holly Crest Ln
- 6529 Highland Crest Ln
- 6606 Highland Crest Ln
- 6612 Highland Crest Ln
- 6618 Highland Crest Ln