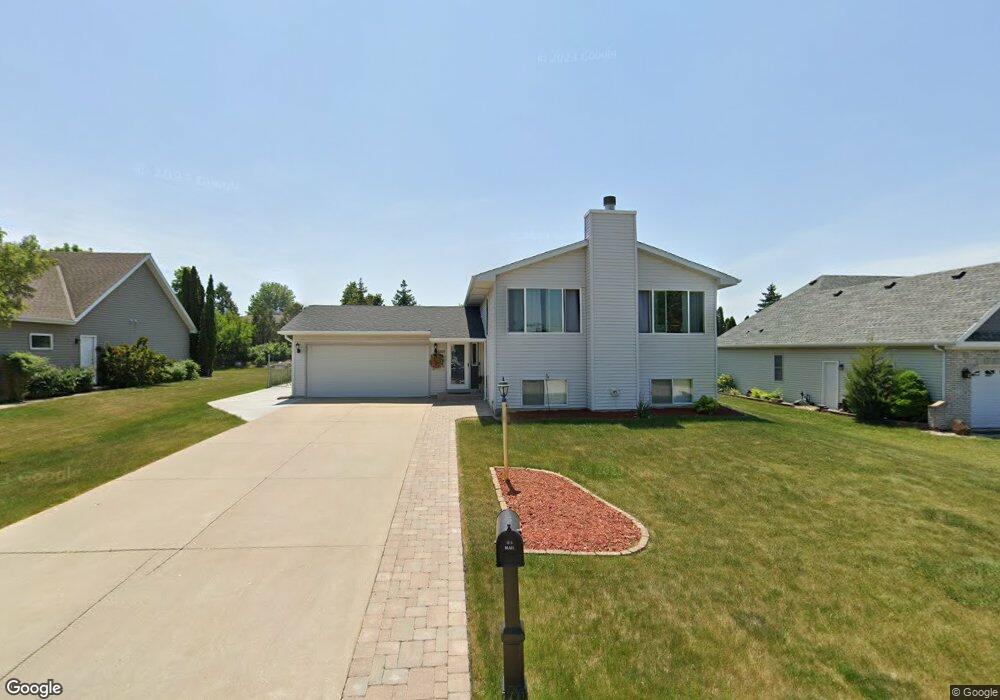
6609 Ranger Dr Mount Pleasant, WI 53406
Estimated Value: $301,000 - $378,000
4
Beds
4
Baths
984
Sq Ft
$353/Sq Ft
Est. Value
About This Home
This home is located at 6609 Ranger Dr, Mount Pleasant, WI 53406 and is currently estimated at $347,751, approximately $353 per square foot. 6609 Ranger Dr is a home located in Racine County with nearby schools including West Ridge Elementary School, Mitchell Middle School, and Case High School.
Ownership History
Date
Name
Owned For
Owner Type
Purchase Details
Closed on
Aug 2, 2019
Sold by
Pintar Cynthia Lee
Bought by
Rivera Jerardo and Rivera Carla
Current Estimated Value
Home Financials for this Owner
Home Financials are based on the most recent Mortgage that was taken out on this home.
Original Mortgage
$170,880
Outstanding Balance
$149,966
Interest Rate
3.8%
Mortgage Type
New Conventional
Estimated Equity
$197,785
Purchase Details
Closed on
Oct 23, 2015
Sold by
Tepsa Ryan Richard and Tepsa Michelle Lee
Bought by
Pintar Cynthia Lee
Purchase Details
Closed on
Apr 5, 2014
Sold by
Bakich Shannon L
Bought by
Tepsa Ryan R
Home Financials for this Owner
Home Financials are based on the most recent Mortgage that was taken out on this home.
Original Mortgage
$167,887
Interest Rate
4.25%
Mortgage Type
FHA
Purchase Details
Closed on
Sep 10, 2013
Sold by
Bakich Shannon Lynn and Bakich Marko Lawrence Chad
Bought by
Bakich Shannon Lynn
Create a Home Valuation Report for This Property
The Home Valuation Report is an in-depth analysis detailing your home's value as well as a comparison with similar homes in the area
Home Values in the Area
Average Home Value in this Area
Purchase History
| Date | Buyer | Sale Price | Title Company |
|---|---|---|---|
| Rivera Jerardo | $213,600 | Fidelity Title Inc | |
| Pintar Cynthia Lee | -- | None Available | |
| Tepsa Ryan R | $173,000 | None Available | |
| Bakich Shannon Lynn | -- | Stewart Title Company |
Source: Public Records
Mortgage History
| Date | Status | Borrower | Loan Amount |
|---|---|---|---|
| Open | Rivera Jerardo | $170,880 | |
| Previous Owner | Tepsa Ryan R | $167,887 |
Source: Public Records
Tax History
| Year | Tax Paid | Tax Assessment Tax Assessment Total Assessment is a certain percentage of the fair market value that is determined by local assessors to be the total taxable value of land and additions on the property. | Land | Improvement |
|---|---|---|---|---|
| 2024 | $4,503 | $291,400 | $56,500 | $234,900 |
| 2023 | $4,149 | $263,100 | $52,700 | $210,400 |
| 2022 | $3,654 | $229,700 | $52,700 | $177,000 |
| 2021 | $3,725 | $209,300 | $47,900 | $161,400 |
| 2020 | $3,569 | $193,000 | $38,300 | $154,700 |
| 2019 | $3,393 | $193,000 | $38,300 | $154,700 |
| 2018 | $3,254 | $171,800 | $36,300 | $135,500 |
| 2017 | $3,194 | $164,800 | $36,300 | $128,500 |
| 2016 | $3,352 | $162,900 | $36,300 | $126,600 |
| 2015 | $3,311 | $162,900 | $36,300 | $126,600 |
| 2014 | $3,128 | $162,900 | $36,300 | $126,600 |
| 2013 | $3,329 | $162,900 | $36,300 | $126,600 |
Source: Public Records
Map
Nearby Homes
- 6520 Mariner Dr Unit 204
- 910 Century Way
- 1131 S Sunnyslope Dr Unit 4U
- Lt0 Mariner Dr
- 6351 Kinzie Ave
- 6441 Kingsview Dr
- 6331 Kingsview Dr
- 940 Prairie Dr Unit 27
- 1040 Prairie Dr Unit 23
- 7225 Mariner Dr Unit 5
- 6335 Washington Ave
- 6330 Ptarmigan Rd
- 522 Calvin Ln
- 583 Hunter Dr
- LT73 Lindsay Ln
- 838 Boulder Trail Unit 205
- 1429 Oakes Rd Unit 7
- 1203 N Sunnyslope Dr Unit 204
- Lt0 Oakes Rd
- 914 S Stuart Rd
- 6619 Ranger Dr
- 6601 Ranger Dr
- 6629 Ranger Dr
- 6549 Ranger Dr
- 802 Sunnyview Dr
- 6620 Ranger Dr
- 6600 Mariner Dr 204
- 6620 Mariner Dr Unit 204
- 6620 Mariner Dr Unit 203
- 6620 Mariner Dr Unit 202
- 6620 Mariner Dr Unit 201
- 6620 Mariner Dr Unit 104
- 6620 Mariner Dr Unit 103
- 6620 Mariner Dr Unit 102
- 6620 Mariner Dr Unit 101
- 6639 Ranger Dr
- 6630 Ranger Dr
- 821 Sunnyview Dr
- 6540 Mariner Dr Unit 204
- 6540 Mariner Dr Unit 203
Your Personal Tour Guide
Ask me questions while you tour the home.