661 Augusta Dr Fairborn, OH 45324
Estimated Value: $269,668 - $335,000
3
Beds
2
Baths
1,600
Sq Ft
$189/Sq Ft
Est. Value
About This Home
This home is located at 661 Augusta Dr, Fairborn, OH 45324 and is currently estimated at $301,917, approximately $188 per square foot. 661 Augusta Dr is a home located in Greene County with nearby schools including Fairborn Primary School, Fairborn Intermediate School, and Fairborn Middle School.
Ownership History
Date
Name
Owned For
Owner Type
Purchase Details
Closed on
Oct 16, 2015
Sold by
Hicks Leslie K and Hicks Paul T
Bought by
Adkins Wavle and Adkins Jayne S
Current Estimated Value
Purchase Details
Closed on
Jul 7, 2011
Sold by
Federal Home Loan Mortgage Corporation
Bought by
Hicks Leslie K
Home Financials for this Owner
Home Financials are based on the most recent Mortgage that was taken out on this home.
Original Mortgage
$107,113
Interest Rate
5.5%
Mortgage Type
FHA
Purchase Details
Closed on
Jun 18, 2010
Sold by
Brandenburg Matthew D
Bought by
Federal Home Loan Mortgage Corporation
Purchase Details
Closed on
Apr 21, 2000
Sold by
Canter Yvonne L and Canter Yvonne L
Bought by
Brandenburg Matthew D
Home Financials for this Owner
Home Financials are based on the most recent Mortgage that was taken out on this home.
Original Mortgage
$106,800
Interest Rate
8.24%
Create a Home Valuation Report for This Property
The Home Valuation Report is an in-depth analysis detailing your home's value as well as a comparison with similar homes in the area
Home Values in the Area
Average Home Value in this Area
Purchase History
| Date | Buyer | Sale Price | Title Company |
|---|---|---|---|
| Adkins Wavle | $142,000 | None Available | |
| Hicks Leslie K | $109,900 | Attorney | |
| Federal Home Loan Mortgage Corporation | $110,036 | None Available | |
| Brandenburg Matthew D | $153,500 | Summit Land Title Agency Inc |
Source: Public Records
Mortgage History
| Date | Status | Borrower | Loan Amount |
|---|---|---|---|
| Previous Owner | Hicks Leslie K | $107,113 | |
| Previous Owner | Brandenburg Matthew D | $106,800 |
Source: Public Records
Tax History
| Year | Tax Paid | Tax Assessment Tax Assessment Total Assessment is a certain percentage of the fair market value that is determined by local assessors to be the total taxable value of land and additions on the property. | Land | Improvement |
|---|---|---|---|---|
| 2025 | $3,390 | $81,210 | $23,210 | $58,000 |
| 2024 | $3,390 | $81,210 | $23,210 | $58,000 |
| 2023 | $3,380 | $81,210 | $23,210 | $58,000 |
| 2022 | $3,104 | $55,040 | $15,470 | $39,570 |
| 2021 | $3,149 | $55,040 | $15,470 | $39,570 |
| 2020 | $3,163 | $55,040 | $15,470 | $39,570 |
| 2019 | $2,835 | $49,530 | $13,400 | $36,130 |
| 2018 | $2,864 | $49,530 | $13,400 | $36,130 |
| 2017 | $2,864 | $49,530 | $13,400 | $36,130 |
| 2016 | $2,864 | $49,650 | $13,400 | $36,250 |
| 2015 | $2,691 | $49,650 | $13,400 | $36,250 |
| 2014 | $2,600 | $49,650 | $13,400 | $36,250 |
Source: Public Records
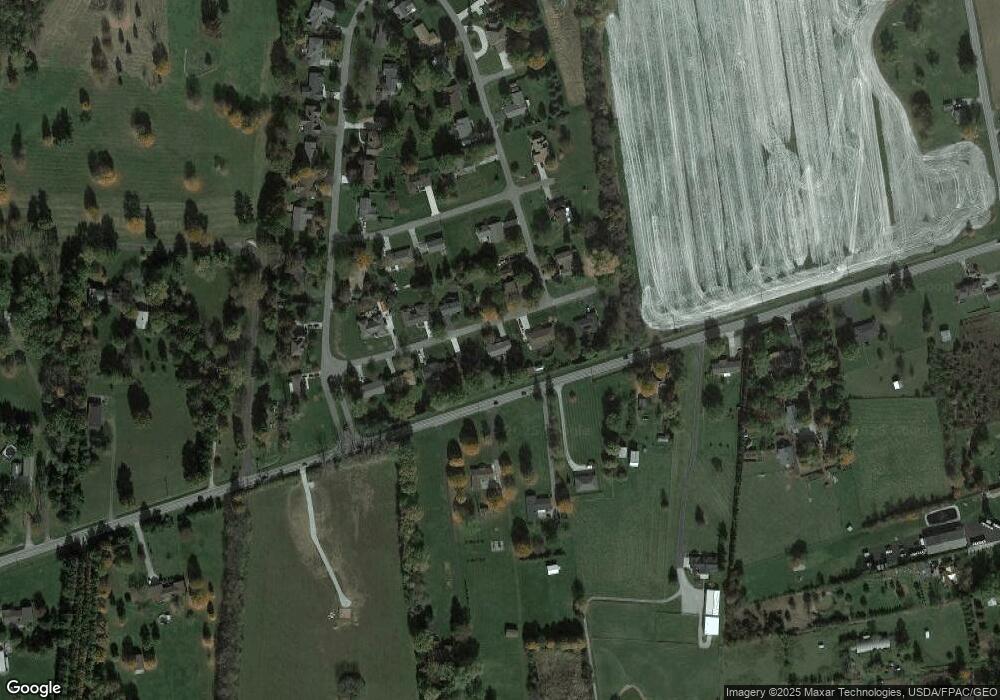
Map
Nearby Homes
- 631 Augusta Dr
- 1494 Indigo Dr
- 1183 Brehm Blvd
- 00 Trebein Rd
- Lot 1 Trebein Rd
- 1155 Elloway Place
- 1622 Arden Bend
- 1634 Arden Bend
- 4863 Horseman Dr
- 110 E Yellow Springs Fairfield Rd
- 345 E Enon Rd
- 4340 E Enon Rd
- 134 Kenneth Hamilton Way
- 140 Kenneth Hamilton Way
- 1197 Crystal Harbour Dr
- 435 Snowdrop Dr
- 535 Iris Dr
- 1200 Whitetail Dr
- 524 Iris Dr
- 1121 Whitetail Dr
- 651 Augusta Dr
- 671 Augusta Dr
- 669 W Dayton Yellow Springs Rd
- 681 Augusta Dr
- 685 W Dayton Yellow Springs Rd
- 657 W Dayton Yellow Springs Rd
- 3773 Greenbriar Dr
- 686 Augusta Dr
- 691 Augusta Dr
- 690 W Dayton Yellow Springs Rd
- 3772 Greenbriar Dr
- 691 Inverness Dr
- 681 Inverness Dr
- 701 Augusta Dr
- 701 Inverness Dr
- 700 Augusta Dr
- 647 W Dayton Yellow Springs Rd
- 3780 Greenbriar Dr
- 3766 Saint Andrews Dr
- 690 Inverness Dr
Your Personal Tour Guide
Ask me questions while you tour the home.