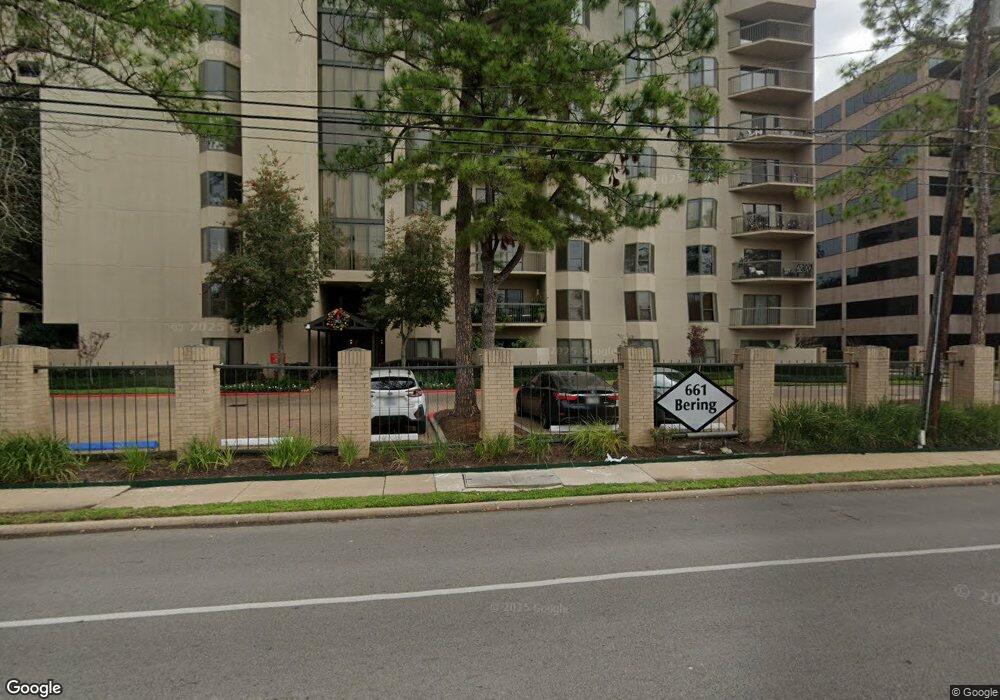
Woodway Place Atrium Condo 661 Bering Dr Unit 411 Houston, TX 77057
Uptown-Galleria District NeighborhoodEstimated Value: $232,511 - $308,000
3
Beds
2
Baths
1,773
Sq Ft
$154/Sq Ft
Est. Value
About This Home
This home is located at 661 Bering Dr Unit 411, Houston, TX 77057 and is currently estimated at $273,378, approximately $154 per square foot. 661 Bering Dr Unit 411 is a home located in Harris County with nearby schools including Briargrove Elementary School, Tanglewood Middle, and Wisdom High School.
Ownership History
Date
Name
Owned For
Owner Type
Purchase Details
Closed on
Feb 16, 2009
Sold by
Stanton Theodore E and Stanton Susan
Bought by
Kahn Michael and Sullivant Kahn Katherine
Current Estimated Value
Home Financials for this Owner
Home Financials are based on the most recent Mortgage that was taken out on this home.
Original Mortgage
$126,400
Outstanding Balance
$79,729
Interest Rate
5.06%
Mortgage Type
Purchase Money Mortgage
Estimated Equity
$193,649
Purchase Details
Closed on
Mar 26, 2007
Sold by
Sage Telecom Inc
Bought by
Stanton Theodore E
Home Financials for this Owner
Home Financials are based on the most recent Mortgage that was taken out on this home.
Original Mortgage
$140,000
Interest Rate
6.3%
Mortgage Type
Purchase Money Mortgage
Purchase Details
Closed on
Dec 28, 2005
Sold by
Mercer William Chad
Bought by
Property Hq Corp
Purchase Details
Closed on
Aug 30, 2004
Sold by
Azle Ltd
Bought by
Mercer William Chad
Create a Home Valuation Report for This Property
The Home Valuation Report is an in-depth analysis detailing your home's value as well as a comparison with similar homes in the area
Home Values in the Area
Average Home Value in this Area
Purchase History
| Date | Buyer | Sale Price | Title Company |
|---|---|---|---|
| Kahn Michael | -- | Etc | |
| Stanton Theodore E | -- | Ameripoint Title | |
| Property Hq Corp | -- | None Available | |
| Mercer William Chad | -- | First American Title |
Source: Public Records
Mortgage History
| Date | Status | Borrower | Loan Amount |
|---|---|---|---|
| Open | Kahn Michael | $126,400 | |
| Previous Owner | Stanton Theodore E | $140,000 |
Source: Public Records
Tax History Compared to Growth
Tax History
| Year | Tax Paid | Tax Assessment Tax Assessment Total Assessment is a certain percentage of the fair market value that is determined by local assessors to be the total taxable value of land and additions on the property. | Land | Improvement |
|---|---|---|---|---|
| 2025 | $345 | $197,025 | $37,435 | $159,590 |
| 2024 | $345 | $196,688 | $37,371 | $159,317 |
| 2023 | $345 | $172,897 | $32,850 | $140,047 |
| 2022 | $4,346 | $218,314 | $44,603 | $173,711 |
| 2021 | $4,182 | $179,435 | $36,469 | $142,966 |
| 2020 | $4,836 | $199,708 | $40,328 | $159,380 |
| 2019 | $5,448 | $215,299 | $45,446 | $169,853 |
| 2018 | $1,835 | $222,700 | $42,313 | $180,387 |
| 2017 | $5,742 | $227,100 | $45,177 | $181,923 |
| 2016 | $5,278 | $223,312 | $42,429 | $180,883 |
| 2015 | $3,387 | $223,312 | $42,429 | $180,883 |
| 2014 | $3,387 | $177,978 | $33,816 | $144,162 |
Source: Public Records
About Woodway Place Atrium Condo
Map
Nearby Homes
- 661 Bering Dr Unit 504
- 661 Bering Dr Unit 207
- 661 Bering Dr Unit 703
- 661 Bering Dr Unit 704
- 651 Bering Dr Unit 1402
- 651 Bering Dr Unit 1603
- 651 Bering Dr Unit 1405
- 651 Bering Dr Unit 1801
- 651 Bering Dr Unit 203
- 651 Bering Dr Unit 1502
- 701 Bering Dr Unit 1006
- 701 Bering Dr Unit 402
- 701 Bering Dr Unit 1405
- 701 Bering Dr Unit 1603
- 701 Bering Dr Unit 1106
- 5506 Russett Dr
- 808 Chimney Rock Rd
- 5665 Pine Forest Rd
- 5736 Tanglewood Cove St
- 716 Bering Dr Unit 31
- 661 Bering Dr Unit 604
- 661 Bering Dr Unit 102
- 661 Bering Dr Unit 306
- 661 Bering Dr Unit 206
- 661 Bering Dr Unit 602
- 661 Bering Dr Unit 606
- 661 Bering Dr Unit 607
- 661 Bering Dr Unit 509
- 661 Bering Dr Unit 304
- 661 Bering Dr Unit 609
- 661 Bering Dr Unit 608
- 661 Bering Dr Unit 603
- 661 Bering Dr Unit 210
- 661 Bering Dr Unit 209
- 661 Bering Dr Unit 811
- 661 Bering Dr Unit 810
- 661 Bering Dr Unit 809
- 661 Bering Dr Unit 808
- 661 Bering Dr Unit 804
- 661 Bering Dr Unit 803