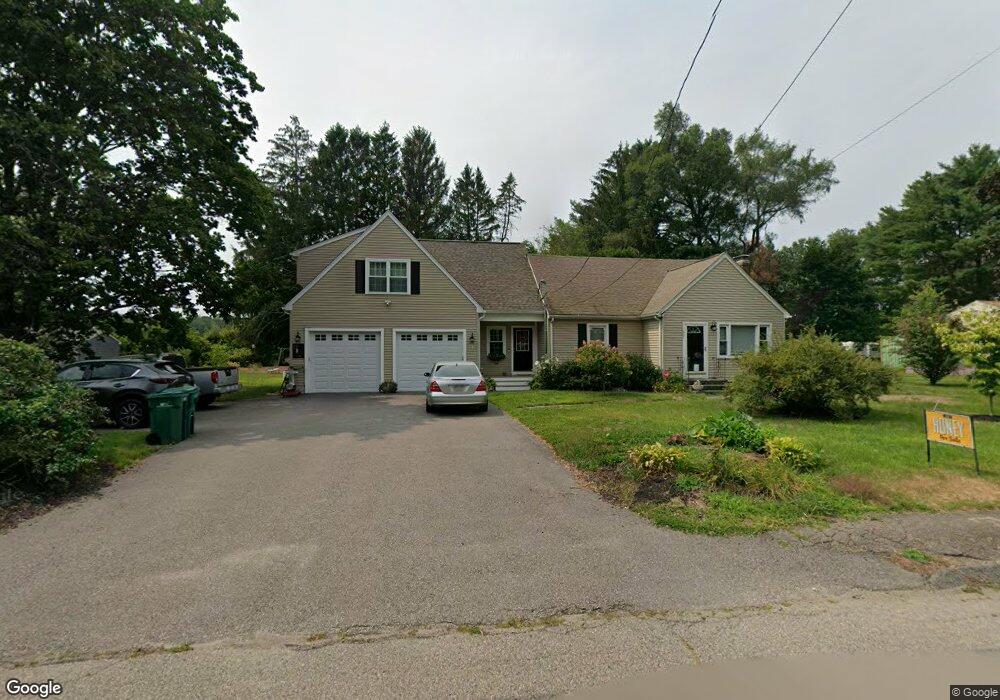
661 Elm St Mansfield, MA 02048
Estimated Value: $623,000 - $919,000
4
Beds
4
Baths
3,542
Sq Ft
$231/Sq Ft
Est. Value
About This Home
This home is located at 661 Elm St, Mansfield, MA 02048 and is currently estimated at $817,094, approximately $230 per square foot. 661 Elm St is a home located in Bristol County with nearby schools including Everett W. Robinson Elementary School, Jordan/Jackson Elementary School, and Harold L. Qualters Middle School.
Ownership History
Date
Name
Owned For
Owner Type
Purchase Details
Closed on
Sep 4, 2018
Sold by
Varney Roger T and Varney Katherine R
Bought by
Breault Justin M and Meesun-Breault Katie E
Current Estimated Value
Home Financials for this Owner
Home Financials are based on the most recent Mortgage that was taken out on this home.
Original Mortgage
$435,521
Outstanding Balance
$379,018
Interest Rate
4.5%
Mortgage Type
New Conventional
Estimated Equity
$438,076
Purchase Details
Closed on
May 26, 1978
Bought by
Varney Roger T and Varney Katherine R
Create a Home Valuation Report for This Property
The Home Valuation Report is an in-depth analysis detailing your home's value as well as a comparison with similar homes in the area
Home Values in the Area
Average Home Value in this Area
Purchase History
| Date | Buyer | Sale Price | Title Company |
|---|---|---|---|
| Breault Justin M | $350,000 | -- | |
| Varney Roger T | $44,500 | -- |
Source: Public Records
Mortgage History
| Date | Status | Borrower | Loan Amount |
|---|---|---|---|
| Open | Breault Justin M | $435,521 | |
| Previous Owner | Varney Roger T | $20,000 | |
| Previous Owner | Varney Roger T | $145,000 |
Source: Public Records
Tax History Compared to Growth
Tax History
| Year | Tax Paid | Tax Assessment Tax Assessment Total Assessment is a certain percentage of the fair market value that is determined by local assessors to be the total taxable value of land and additions on the property. | Land | Improvement |
|---|---|---|---|---|
| 2025 | $8,776 | $666,400 | $243,500 | $422,900 |
| 2024 | $9,073 | $672,100 | $243,500 | $428,600 |
| 2023 | $8,896 | $631,400 | $243,500 | $387,900 |
| 2022 | $8,542 | $563,100 | $225,400 | $337,700 |
| 2021 | $8,050 | $524,100 | $197,300 | $326,800 |
| 2020 | $7,531 | $490,300 | $187,900 | $302,400 |
| 2019 | $5,423 | $356,300 | $156,500 | $199,800 |
| 2018 | $4,933 | $343,700 | $149,300 | $194,400 |
| 2017 | $4,830 | $321,600 | $145,000 | $176,600 |
| 2016 | $4,626 | $300,200 | $138,100 | $162,100 |
| 2015 | $4,597 | $296,600 | $138,100 | $158,500 |
Source: Public Records
Map
Nearby Homes
- 37 Oakleaf Dr
- 2 Oak St Unit 2D
- 2 Oak St Unit 2A
- 2 Oak St Unit 2C
- 2 Oak St Unit 2B
- 176 Elm St
- 451R Gilbert St
- 9 Larson Farm Dr
- 14 Country Club Way
- 150 Gilbert St
- 250 Mansfield Ave Unit 66
- 4 Village Way Unit F
- 4 Buckskin Dr
- 47 Old Farm Rd
- 157 Mansfield Ave Unit 14
- 19 Precourt Ln
- 15 Reservoir St Unit 44
- 933 Pleasant St
- 16 Park Ln
- 18 Columbine Rd