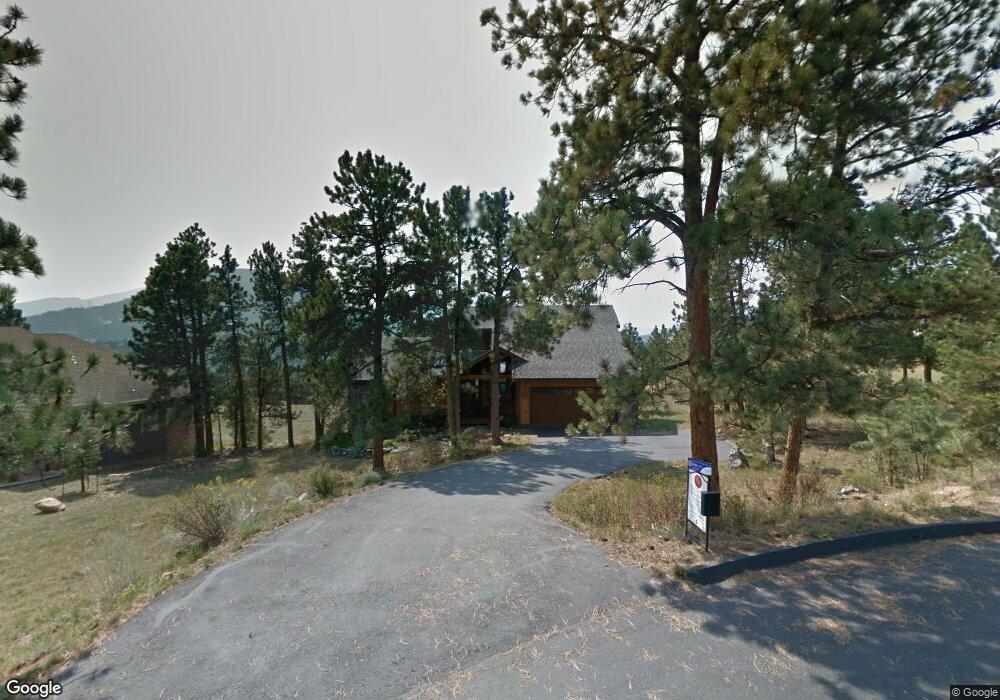
661 Findley Ct Estes Park, CO 80517
Estimated Value: $1,018,855 - $1,377,000
4
Beds
4
Baths
3,124
Sq Ft
$410/Sq Ft
Est. Value
About This Home
This home is located at 661 Findley Ct, Estes Park, CO 80517 and is currently estimated at $1,280,464, approximately $409 per square foot. 661 Findley Ct is a home located in Larimer County with nearby schools including Estes Park K-5 School, Estes Park Options School, and Estes Park Middle School.
Ownership History
Date
Name
Owned For
Owner Type
Purchase Details
Closed on
Nov 10, 2020
Sold by
Schuch Karl L and Schuch Cherie R
Bought by
Karl L Schuch And Cherie Hall-Schuch Revocabl
Current Estimated Value
Purchase Details
Closed on
Dec 3, 2012
Sold by
Birkey Melvin D and Birkey Nancy J
Bought by
Schuch Karl L and Schuch Cherie R
Purchase Details
Closed on
Feb 27, 1998
Sold by
Stanley Views Limited
Bought by
Birkey Melvin D and Birkey Nancy J
Home Financials for this Owner
Home Financials are based on the most recent Mortgage that was taken out on this home.
Original Mortgage
$69,725
Interest Rate
8%
Mortgage Type
Seller Take Back
Purchase Details
Closed on
Feb 20, 1998
Sold by
Mountain Creek Partnership
Bought by
Stanley View Ltd
Home Financials for this Owner
Home Financials are based on the most recent Mortgage that was taken out on this home.
Original Mortgage
$69,725
Interest Rate
8%
Mortgage Type
Seller Take Back
Purchase Details
Closed on
Jul 1, 1994
Sold by
Fhk Co
Bought by
Findley W Brooks
Create a Home Valuation Report for This Property
The Home Valuation Report is an in-depth analysis detailing your home's value as well as a comparison with similar homes in the area
Home Values in the Area
Average Home Value in this Area
Purchase History
| Date | Buyer | Sale Price | Title Company |
|---|---|---|---|
| Karl L Schuch And Cherie Hall-Schuch Revocabl | -- | None Listed On Document | |
| Schuch Karl L | $600,000 | Ats | |
| Birkey Melvin D | $92,300 | -- | |
| Stanley View Ltd | -- | -- | |
| Findley W Brooks | -- | -- |
Source: Public Records
Mortgage History
| Date | Status | Borrower | Loan Amount |
|---|---|---|---|
| Previous Owner | Birkey Melvin D | $69,725 |
Source: Public Records
Tax History Compared to Growth
Tax History
| Year | Tax Paid | Tax Assessment Tax Assessment Total Assessment is a certain percentage of the fair market value that is determined by local assessors to be the total taxable value of land and additions on the property. | Land | Improvement |
|---|---|---|---|---|
| 2025 | $5,157 | $74,089 | $17,420 | $56,669 |
| 2024 | $5,069 | $74,089 | $17,420 | $56,669 |
| 2022 | $3,875 | $50,749 | $12,163 | $38,586 |
| 2021 | $3,979 | $52,210 | $12,513 | $39,697 |
| 2020 | $3,699 | $47,927 | $12,513 | $35,414 |
| 2019 | $3,679 | $47,927 | $12,513 | $35,414 |
| 2018 | $3,112 | $39,319 | $9,000 | $30,319 |
| 2017 | $3,129 | $39,319 | $9,000 | $30,319 |
| 2016 | $3,039 | $40,477 | $12,577 | $27,900 |
| 2015 | $3,071 | $40,480 | $12,580 | $27,900 |
| 2014 | $2,635 | $35,620 | $13,130 | $22,490 |
Source: Public Records
Map
Nearby Homes
- 641 Findley Ct
- 680 Findley Ct
- 402 Overlook Ct
- 343 Overlook Ln
- 325 Overlook Ln
- 293 Overlook Ct
- 341 Homesteader Ln
- 206 Twin Owls Ln
- 269 Steamer Ct
- 445 Skyline Dr
- 476 Macgregor Ave Unit A3
- 620 Macgregor Ave Unit 2
- 220 Virginia Dr Unit 8
- 131 Willowstone Ct
- 950 Big Thompson Ave Unit A1152
- 242 Virginia Dr
- Lot 744 St Vrain Dr Unit 4723401238
- Lot 744 St Vrain Dr
- 850 North Ln
- 1180 Coyote Run
- 651 Findley Ct
- 681 Findley Ct
- 12 Findley Ct
- 691 Findley Ct
- 418 Overlook Ct Unit 418
- 699 Findley Ct
- 416 Overlook Ct
- 631 Findley Ct
- 670 Findley Ct
- 412 Overlook Ct
- 660 Findley Ct
- 414 Overlook Ct Unit 414
- 410 Overlook Ct
- 650 Findley Ct
- 408 Overlook Ct
- 640 Findley Ct
- 406 Overlook Ct Unit 406
- 630 Findley Ct
- 611 Findley Ct
- 690 Steamer Dr