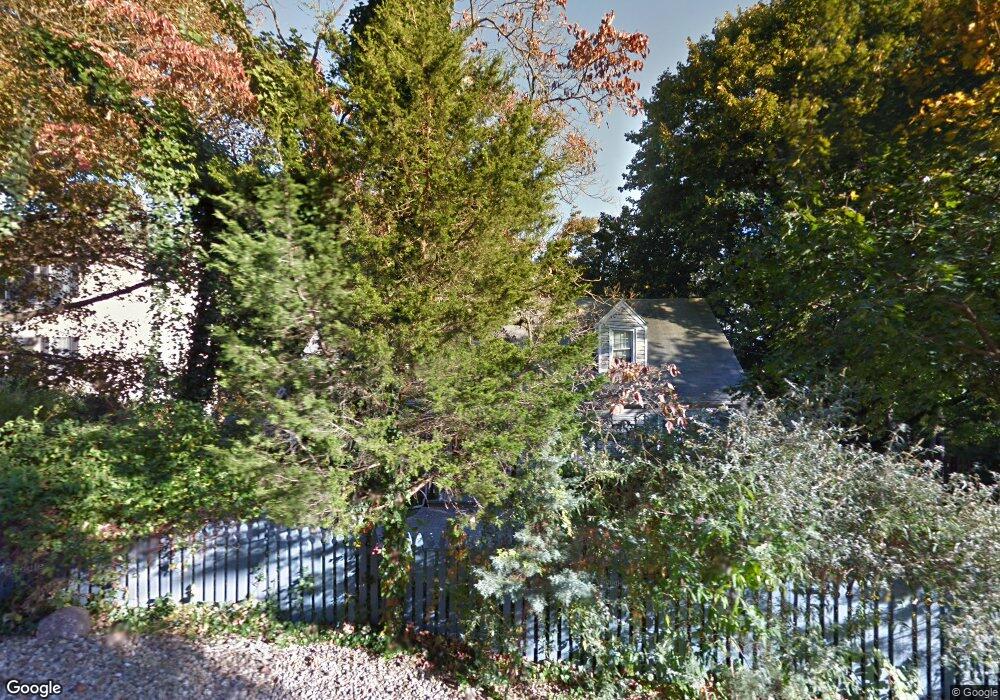
661 Liberty St Boonton, NJ 07005
Estimated Value: $574,000 - $722,000
--
Bed
--
Bath
2,060
Sq Ft
$313/Sq Ft
Est. Value
About This Home
This home is located at 661 Liberty St, Boonton, NJ 07005 and is currently estimated at $645,244, approximately $313 per square foot. 661 Liberty St is a home located in Morris County with nearby schools including School Street Elementary School, John Hill Elementary School, and Boonton High School.
Ownership History
Date
Name
Owned For
Owner Type
Purchase Details
Closed on
Mar 11, 2005
Sold by
Theriault Brian
Bought by
Porfido Samuel and Scalo Mary
Current Estimated Value
Home Financials for this Owner
Home Financials are based on the most recent Mortgage that was taken out on this home.
Original Mortgage
$354,900
Outstanding Balance
$187,497
Interest Rate
6.25%
Mortgage Type
Adjustable Rate Mortgage/ARM
Estimated Equity
$457,747
Purchase Details
Closed on
Oct 27, 1995
Sold by
Stavish John Patrick and Stavish Adele Claire
Bought by
Theriault Brian D and Theriault Jacqueline
Create a Home Valuation Report for This Property
The Home Valuation Report is an in-depth analysis detailing your home's value as well as a comparison with similar homes in the area
Home Values in the Area
Average Home Value in this Area
Purchase History
| Date | Buyer | Sale Price | Title Company |
|---|---|---|---|
| Porfido Samuel | $449,900 | -- | |
| Theriault Brian D | $195,000 | -- |
Source: Public Records
Mortgage History
| Date | Status | Borrower | Loan Amount |
|---|---|---|---|
| Open | Porfido Samuel | $354,900 |
Source: Public Records
Tax History Compared to Growth
Tax History
| Year | Tax Paid | Tax Assessment Tax Assessment Total Assessment is a certain percentage of the fair market value that is determined by local assessors to be the total taxable value of land and additions on the property. | Land | Improvement |
|---|---|---|---|---|
| 2025 | $12,989 | $384,300 | $182,300 | $202,000 |
| 2024 | $12,647 | $384,300 | $182,300 | $202,000 |
| 2023 | $12,647 | $384,300 | $182,300 | $202,000 |
| 2022 | $11,986 | $384,300 | $182,300 | $202,000 |
| 2021 | $11,986 | $384,300 | $182,300 | $202,000 |
| 2020 | $11,491 | $384,300 | $182,300 | $202,000 |
| 2019 | $11,640 | $384,300 | $182,300 | $202,000 |
| 2018 | $11,333 | $384,300 | $182,300 | $202,000 |
| 2017 | $10,860 | $384,300 | $182,300 | $202,000 |
| 2016 | $10,576 | $384,300 | $182,300 | $202,000 |
| 2015 | $10,403 | $384,300 | $182,300 | $202,000 |
| 2014 | $10,172 | $384,300 | $182,300 | $202,000 |
Source: Public Records
Map
Nearby Homes