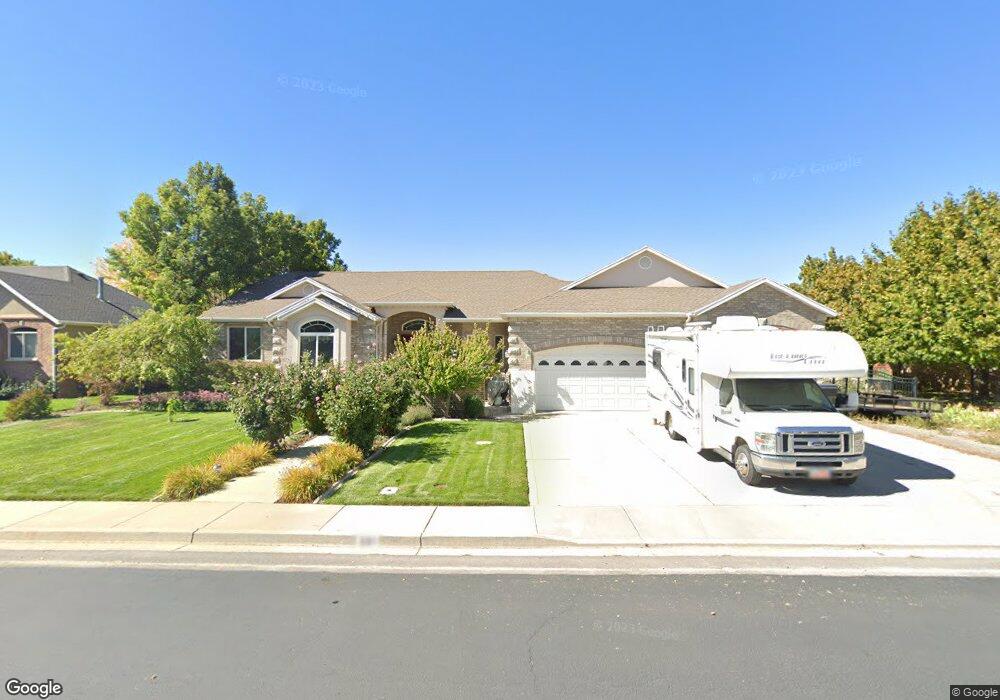
661 N 540 E Mapleton, UT 84664
Estimated Value: $1,098,000 - $1,378,000
5
Beds
5
Baths
3,218
Sq Ft
$390/Sq Ft
Est. Value
About This Home
This home is located at 661 N 540 E, Mapleton, UT 84664 and is currently estimated at $1,253,506, approximately $389 per square foot. 661 N 540 E is a home located in Utah County with nearby schools including Hobble Creek School, Mapleton Junior High School, and Maple Mountain High School.
Ownership History
Date
Name
Owned For
Owner Type
Purchase Details
Closed on
Feb 6, 2004
Sold by
Dawe A Gordon and Dawe Ann E
Bought by
Dawe A Gordon and Dawe Ann E
Current Estimated Value
Purchase Details
Closed on
Dec 7, 1998
Sold by
Mcgraw Alan and Mcgraw Tammy
Bought by
Dawe A Gordon and Dawe E
Purchase Details
Closed on
Sep 24, 1998
Sold by
Mcgraw Alan and Mcgraw Tammy
Bought by
Dawe A Gordon and Dawe E
Purchase Details
Closed on
Oct 9, 1997
Sold by
Hodge Jack W
Bought by
Mcgraw Alan and Mcgraw Tammy
Home Financials for this Owner
Home Financials are based on the most recent Mortgage that was taken out on this home.
Original Mortgage
$42,750
Interest Rate
7.54%
Purchase Details
Closed on
Jul 15, 1996
Sold by
Maple Creek Farms Llc
Bought by
Hodge Jack W
Home Financials for this Owner
Home Financials are based on the most recent Mortgage that was taken out on this home.
Original Mortgage
$41,250
Interest Rate
8.39%
Create a Home Valuation Report for This Property
The Home Valuation Report is an in-depth analysis detailing your home's value as well as a comparison with similar homes in the area
Home Values in the Area
Average Home Value in this Area
Purchase History
| Date | Buyer | Sale Price | Title Company |
|---|---|---|---|
| Dawe A Gordon | -- | -- | |
| Dawe A Gordon | -- | First American Title Co | |
| Dawe A Gordon | -- | First American Title | |
| Mcgraw Alan | -- | -- | |
| Hodge Jack W | -- | -- |
Source: Public Records
Mortgage History
| Date | Status | Borrower | Loan Amount |
|---|---|---|---|
| Previous Owner | Mcgraw Alan | $42,750 | |
| Previous Owner | Hodge Jack W | $41,250 |
Source: Public Records
Tax History
| Year | Tax Paid | Tax Assessment Tax Assessment Total Assessment is a certain percentage of the fair market value that is determined by local assessors to be the total taxable value of land and additions on the property. | Land | Improvement |
|---|---|---|---|---|
| 2025 | $5,725 | $654,005 | -- | -- |
| 2024 | $5,725 | $560,835 | $0 | $0 |
| 2023 | $5,827 | $574,420 | $0 | $0 |
| 2022 | $5,698 | $555,445 | $0 | $0 |
| 2021 | $4,918 | $736,000 | $177,200 | $558,800 |
| 2020 | $4,943 | $715,600 | $156,800 | $558,800 |
| 2019 | $4,800 | $709,200 | $150,400 | $558,800 |
| 2018 | $4,636 | $652,100 | $126,700 | $525,400 |
| 2017 | $4,746 | $354,310 | $0 | $0 |
| 2016 | $4,715 | $349,910 | $0 | $0 |
| 2015 | $4,145 | $305,745 | $0 | $0 |
| 2014 | -- | $270,765 | $0 | $0 |
Source: Public Records
Map
Nearby Homes
- 265 E 600 N
- 594 E 1000 N
- 775 N 800 E
- 435 E 1000 N
- 84 E 530 N
- 141 N 600 E
- 310 N 800 E
- 1096 N 1000 E
- 162 N 800 E
- 415 E Maple St
- 745 E Maple St
- 1350 N Main St
- 1377 E Maple St
- 1567 N 600 E Unit 26
- 1447 N 1350 St E Unit 5
- 1577 N 1350 St E Unit 1
- 1477 N 1350 St E Unit 4
- 1547 N 1350 St E Unit 2
- 1511 N 1350 St E Unit 3
- 1548 N 1350 St E Unit 11
Your Personal Tour Guide
Ask me questions while you tour the home.