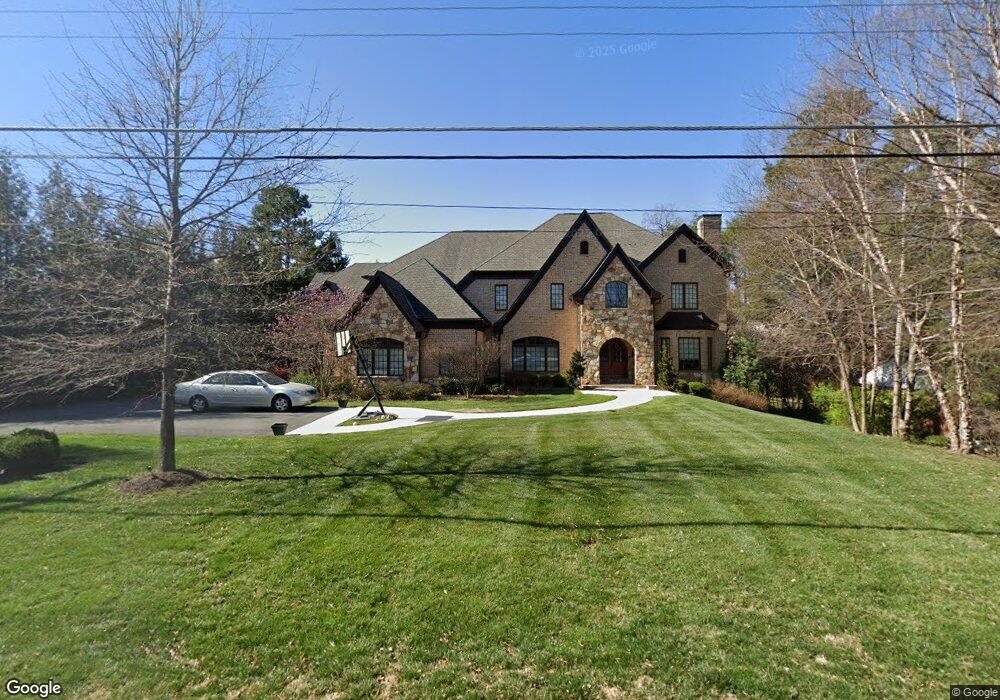
6611 Brawner St McLean, VA 22101
Estimated Value: $4,031,000 - $4,444,000
6
Beds
7
Baths
6,764
Sq Ft
$623/Sq Ft
Est. Value
About This Home
This home is located at 6611 Brawner St, McLean, VA 22101 and is currently estimated at $4,214,778, approximately $623 per square foot. 6611 Brawner St is a home located in Fairfax County with nearby schools including Sherman Elementary School, Longfellow Middle School, and McLean High School.
Ownership History
Date
Name
Owned For
Owner Type
Purchase Details
Closed on
Oct 19, 2010
Sold by
Lin Cheng C
Bought by
Lengkong Denny
Current Estimated Value
Purchase Details
Closed on
Jun 12, 2007
Sold by
Moya Juan J
Bought by
Lin Cheng Chung
Purchase Details
Closed on
Sep 23, 2005
Sold by
Heath Joseph F
Bought by
Moya Juan J
Home Financials for this Owner
Home Financials are based on the most recent Mortgage that was taken out on this home.
Original Mortgage
$700,000
Interest Rate
5.92%
Mortgage Type
New Conventional
Purchase Details
Closed on
Jul 29, 2005
Sold by
Reichardt Manfred
Bought by
Heath Joseph F
Home Financials for this Owner
Home Financials are based on the most recent Mortgage that was taken out on this home.
Original Mortgage
$700,000
Interest Rate
5.92%
Mortgage Type
New Conventional
Create a Home Valuation Report for This Property
The Home Valuation Report is an in-depth analysis detailing your home's value as well as a comparison with similar homes in the area
Home Values in the Area
Average Home Value in this Area
Purchase History
| Date | Buyer | Sale Price | Title Company |
|---|---|---|---|
| Lengkong Denny | $700,000 | -- | |
| Lin Cheng Chung | $800,000 | -- | |
| Moya Juan J | $970,000 | -- | |
| Heath Joseph F | $755,000 | -- |
Source: Public Records
Mortgage History
| Date | Status | Borrower | Loan Amount |
|---|---|---|---|
| Previous Owner | Moya Juan J | $700,000 | |
| Previous Owner | Heath Joseph F | $550,000 |
Source: Public Records
Tax History
| Year | Tax Paid | Tax Assessment Tax Assessment Total Assessment is a certain percentage of the fair market value that is determined by local assessors to be the total taxable value of land and additions on the property. | Land | Improvement |
|---|---|---|---|---|
| 2025 | $41,223 | $3,835,680 | $940,000 | $2,895,680 |
| 2023 | $36,337 | $3,155,610 | $720,000 | $2,435,610 |
| 2022 | $34,484 | $2,956,170 | $525,000 | $2,431,170 |
| 2021 | $35,475 | $2,964,920 | $525,000 | $2,439,920 |
| 2020 | $35,799 | $2,967,190 | $525,000 | $2,442,190 |
| 2019 | $35,292 | $2,925,180 | $510,000 | $2,415,180 |
| 2018 | $31,565 | $2,744,740 | $490,000 | $2,254,740 |
| 2017 | $32,498 | $2,744,740 | $490,000 | $2,254,740 |
| 2016 | $31,042 | $2,627,370 | $480,000 | $2,147,370 |
Source: Public Records
Map
Nearby Homes
- 1465 Hampton Hill Cir
- 6519 Brawner St
- 6654 Chilton Ct
- 6634 Brawner St
- 6718 Lowell Ave Unit PH 906
- 6718 Lowell Ave Unit 702
- 6718 Lowell Ave Unit 604
- 1318 Kurtz Rd
- 1434 Waggaman Cir
- 1471 Waggaman Cir
- 1316 Calder Rd
- 6800 Fleetwood Rd Unit 1004
- 6800 Fleetwood Rd Unit 1002
- 6800 Fleetwood Rd Unit 705
- 6900 Fleetwood Rd Unit 600
- 1537 Cedar Ave
- 6529 Sothoron Rd
- 1623 Dempsey St
- 6523 Old Chesterbrook Rd
- 6816 Rigby Ln
- 1451 Hampton Hill Cir
- 6613 Brawner St
- 6609 Brawner St
- 1500 Hampton Hill Cir
- 1498 Hampton Hill Cir
- 1496 Hampton Hill Cir
- 1504 Hampton Hill Cir
- 1494 Hampton Hill Cir
- 1506 Hampton Hill Cir
- 1492 Hampton Hill Cir
- 6612 Brawner St
- 1508 Hampton Hill Cir
- 1490 Hampton Hill Cir
- 1488 Hampton Hill Cir
- 1510 Hampton Hill Cir
- 6608 Brawner St
- 1486 Hampton Hill Cir
- 1512 Hampton Hill Cir
- 6605 Brawner St
- 6600 Anthony Crest Square
Your Personal Tour Guide
Ask me questions while you tour the home.