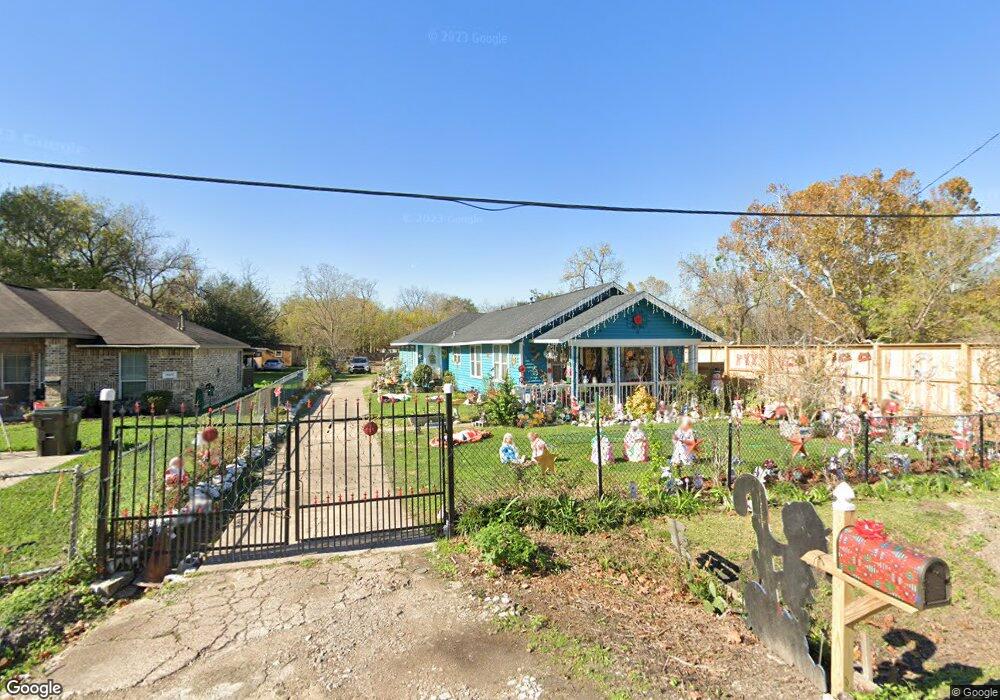
6611 Lavender St Houston, TX 77028
Trinity-Houston Gardens NeighborhoodEstimated Value: $187,740 - $217,000
4
Beds
2
Baths
1,680
Sq Ft
$120/Sq Ft
Est. Value
About This Home
This home is located at 6611 Lavender St, Houston, TX 77028 and is currently estimated at $201,935, approximately $120 per square foot. 6611 Lavender St is a home located in Harris County with nearby schools including Felix Cook Jr. Elementary School, Key Middle, and Kashmere High School.
Ownership History
Date
Name
Owned For
Owner Type
Purchase Details
Closed on
Jul 12, 2010
Sold by
W L Y Partnership
Bought by
Guerrero Ruth N and Martinez Karla N
Current Estimated Value
Purchase Details
Closed on
Oct 7, 2009
Sold by
Anthony Roshonda Colleen and Hamilton Dante
Bought by
W L Y Partnership
Purchase Details
Closed on
Feb 20, 2009
Sold by
Wly Partnership
Bought by
Anthony Roshonda Colleen and Hamilton Dante
Purchase Details
Closed on
Jul 28, 2007
Sold by
Gilbert Earl M
Bought by
W L Y Partnership
Purchase Details
Closed on
Jul 27, 2007
Sold by
Bailey Kathy Walker and Walker Semiko
Bought by
Gilbert Earl M
Purchase Details
Closed on
Oct 20, 1994
Sold by
N/W Lone Star Financial Services Inc
Bought by
Wright Eddie
Purchase Details
Closed on
Jul 20, 1994
Sold by
Mcgraw Abner George and Mcgraw Dora L
Bought by
N/W Lone Star Financial Services Inc
Create a Home Valuation Report for This Property
The Home Valuation Report is an in-depth analysis detailing your home's value as well as a comparison with similar homes in the area
Home Values in the Area
Average Home Value in this Area
Purchase History
| Date | Buyer | Sale Price | Title Company |
|---|---|---|---|
| Guerrero Ruth N | -- | None Available | |
| W L Y Partnership | $59,663 | None Available | |
| Anthony Roshonda Colleen | -- | None Available | |
| W L Y Partnership | -- | None Available | |
| Gilbert Earl M | -- | Southern American Title West | |
| Wright Eddie | -- | -- | |
| N/W Lone Star Financial Services Inc | -- | -- |
Source: Public Records
Mortgage History
| Date | Status | Borrower | Loan Amount |
|---|---|---|---|
| Closed | Anthony Roshonda Colleen | $0 |
Source: Public Records
Tax History Compared to Growth
Tax History
| Year | Tax Paid | Tax Assessment Tax Assessment Total Assessment is a certain percentage of the fair market value that is determined by local assessors to be the total taxable value of land and additions on the property. | Land | Improvement |
|---|---|---|---|---|
| 2025 | $926 | $149,828 | $66,250 | $83,578 |
| 2024 | $926 | $137,709 | $66,250 | $71,459 |
| 2023 | $926 | $128,894 | $66,250 | $62,644 |
| 2022 | $1,716 | $102,496 | $53,000 | $49,496 |
| 2021 | $1,652 | $91,169 | $33,125 | $58,044 |
| 2020 | $1,560 | $76,022 | $26,500 | $49,522 |
| 2019 | $1,482 | $62,523 | $17,888 | $44,635 |
| 2018 | $781 | $54,547 | $14,575 | $39,972 |
| 2017 | $1,224 | $54,547 | $14,575 | $39,972 |
| 2016 | $1,113 | $50,927 | $14,575 | $36,352 |
| 2015 | $646 | $40,000 | $14,575 | $25,425 |
| 2014 | $646 | $40,000 | $14,575 | $25,425 |
Source: Public Records
Map
Nearby Homes
- 4605 Baton Rouge St
- 4603 Baton Rouge St
- 4616 Shreveport Blvd
- 4807 Shreveport Blvd
- 6605 Lockwood Dr
- 4811 Shreveport Blvd
- 4843 Shreveport Blvd
- 6221 Lavender St
- 7006 Bonita St
- 5017 Baton Rouge St
- 6226 Kashmere St
- 6809 Glass St
- 6305 Kashmere St
- 4322 Bennington St
- 7210 Lockwood Dr Unit 1
- 4310 Bennington St
- 4421 Caplin St
- 0 Bonita St Unit 45150086
- 5317 Caplin St
- 7317 Lockwood Dr
- 6625 Lavender St
- 6533 Lavender St
- 6533 Lavender St
- 6707 Lavender St
- 4709 Shreveport Blvd
- 6607 Lavender St
- 6711 Lavender St
- 6606 Lavender St
- 6622 Lavender St
- 6702 Lavender St
- 4714 Shreveport Blvd
- 0 N Shreveport Unit 29967174
- 6708 Lavender St
- 6618 Lavender St
- 6515 Lavender St
- 4711 Shreveport Blvd
- 6710 Lavender St
- 4713 Baton Rouge St
- 6511 Lavender St
- 4705 Shreveport Blvd