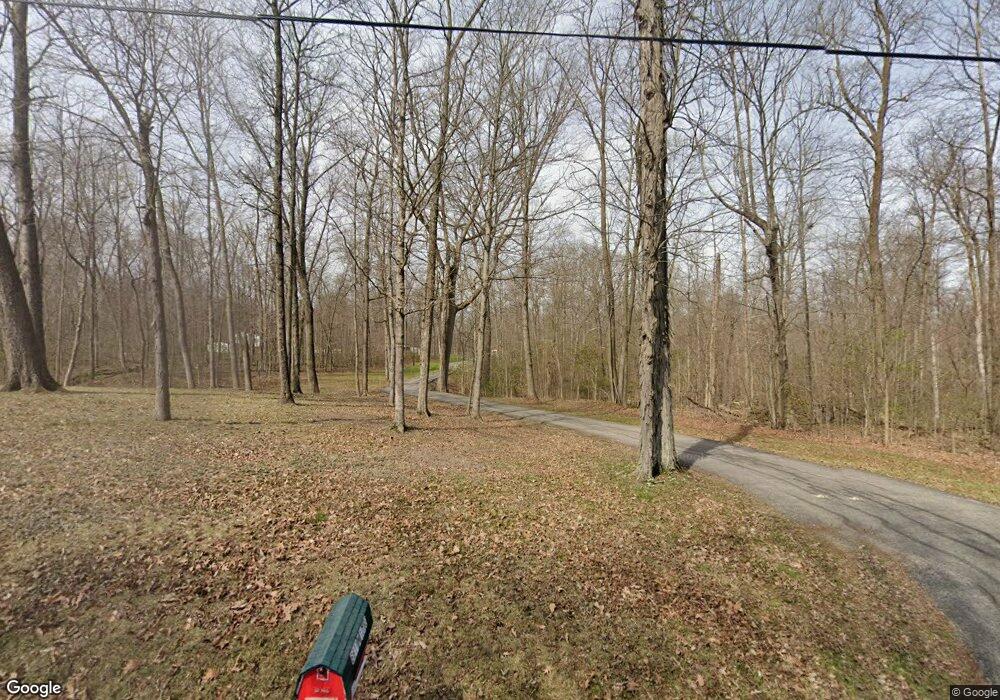
6611 N 100 E Marion, IN 46952
Estimated Value: $284,000 - $539,000
4
Beds
4
Baths
4,380
Sq Ft
$91/Sq Ft
Est. Value
About This Home
This home is located at 6611 N 100 E, Marion, IN 46952 and is currently estimated at $399,033, approximately $91 per square foot. 6611 N 100 E is a home located in Grant County.
Ownership History
Date
Name
Owned For
Owner Type
Purchase Details
Closed on
Feb 23, 2024
Sold by
Carl L Clark L and Carl Eleanor L
Bought by
Forrer Melissa A and Bush Franklin B
Current Estimated Value
Home Financials for this Owner
Home Financials are based on the most recent Mortgage that was taken out on this home.
Original Mortgage
$434,610
Outstanding Balance
$404,600
Interest Rate
5.87%
Mortgage Type
New Conventional
Estimated Equity
-$5,567
Purchase Details
Closed on
Oct 16, 2002
Sold by
Not Provided
Bought by
Not Provided
Create a Home Valuation Report for This Property
The Home Valuation Report is an in-depth analysis detailing your home's value as well as a comparison with similar homes in the area
Purchase History
| Date | Buyer | Sale Price | Title Company |
|---|---|---|---|
| Forrer Melissa A | $241,450 | None Listed On Document | |
| Forrer Melissa A | $241,450 | None Listed On Document | |
| Not Provided | -- | -- |
Source: Public Records
Mortgage History
| Date | Status | Borrower | Loan Amount |
|---|---|---|---|
| Open | Forrer Melissa A | $434,610 |
Source: Public Records
Tax History Compared to Growth
Tax History
| Year | Tax Paid | Tax Assessment Tax Assessment Total Assessment is a certain percentage of the fair market value that is determined by local assessors to be the total taxable value of land and additions on the property. | Land | Improvement |
|---|---|---|---|---|
| 2024 | $2,772 | $375,700 | $62,200 | $313,500 |
| 2023 | $2,584 | $332,400 | $62,200 | $270,200 |
| 2022 | $2,449 | $286,100 | $52,100 | $234,000 |
| 2021 | $2,162 | $248,400 | $52,100 | $196,300 |
| 2020 | $1,979 | $239,800 | $52,100 | $187,700 |
| 2019 | $1,872 | $239,300 | $52,100 | $187,200 |
| 2018 | $1,698 | $227,300 | $52,100 | $175,200 |
| 2017 | $1,511 | $214,200 | $52,100 | $162,100 |
| 2016 | $1,431 | $214,200 | $52,100 | $162,100 |
| 2014 | $1,380 | $211,700 | $52,100 | $159,600 |
| 2013 | $1,380 | $211,300 | $52,100 | $159,200 |
Source: Public Records
Map
Nearby Homes
- 4858 N 300 E
- 4493 N Wabash Rd
- 933 E Bocock Rd
- 403 E Kendall St
- 4180 N Wabash Rd
- 204 S Main St
- 3960 N Woodbine Dr
- 3930 N Avalon Dr
- 3920 N Avalon Dr
- 3105 N Huntington Rd
- 2325 N Huntington Rd
- 1906 W James Dr
- 2220 N Huntington Rd
- 1916 W James Dr
- 2214 N Wabash Rd
- 3576 W 505 N
- 1502 N Baldwin Ave
- 1614 Fox Trail Unit 1
- 703 E Bond Ave
- 1431 Fox Trail Unit 49
