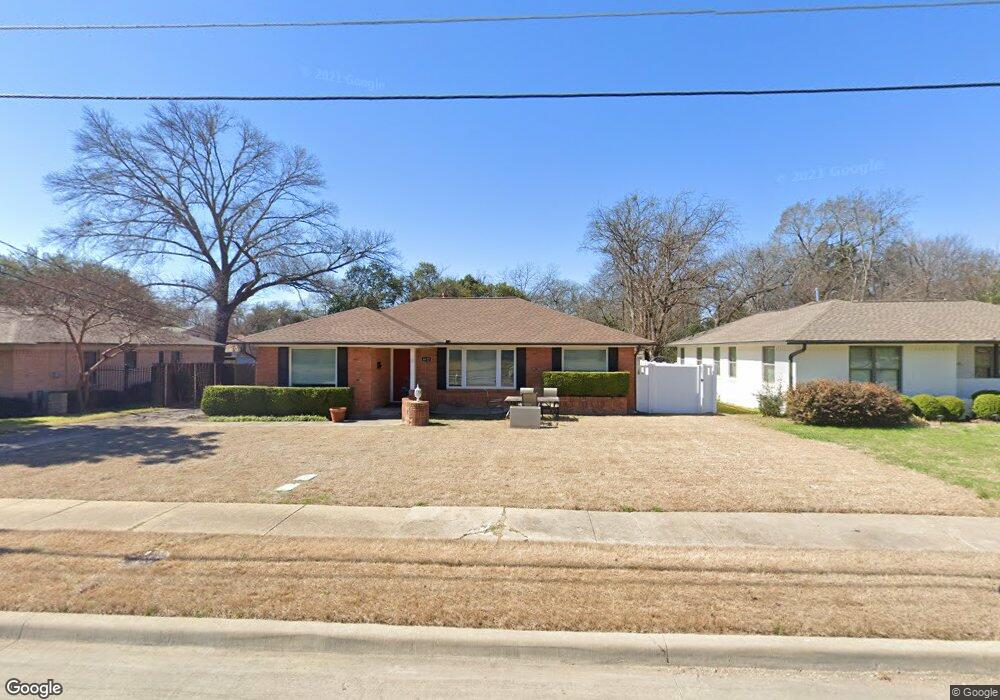
6611 Santa Anita Dr Dallas, TX 75214
Northeast Dallas NeighborhoodEstimated Value: $690,000 - $719,000
3
Beds
2
Baths
1,746
Sq Ft
$402/Sq Ft
Est. Value
About This Home
This home is located at 6611 Santa Anita Dr, Dallas, TX 75214 and is currently estimated at $702,100, approximately $402 per square foot. 6611 Santa Anita Dr is a home located in Dallas County with nearby schools including Dan D Rogers Elementary School, Benjamin Franklin International Exploratory Academy, and Hillcrest High School.
Ownership History
Date
Name
Owned For
Owner Type
Purchase Details
Closed on
Jul 8, 2021
Sold by
House Marydella
Bought by
House Marydella and House Laura G
Current Estimated Value
Purchase Details
Closed on
May 2, 2001
Sold by
Sanders Harvey L and White Mario D
Bought by
House Laura G and House Marydella
Home Financials for this Owner
Home Financials are based on the most recent Mortgage that was taken out on this home.
Original Mortgage
$147,200
Outstanding Balance
$54,069
Interest Rate
6.81%
Estimated Equity
$648,031
Purchase Details
Closed on
Apr 14, 2000
Sold by
Ricks Randall L
Bought by
Sanders Harvey L and White Mario D
Home Financials for this Owner
Home Financials are based on the most recent Mortgage that was taken out on this home.
Original Mortgage
$141,928
Interest Rate
8.27%
Mortgage Type
FHA
Purchase Details
Closed on
Jun 9, 1997
Sold by
Musslewhite Gordia Myree and Musslewhite Chapple William
Bought by
Ricks Randall Lee and Biassi Matthew
Create a Home Valuation Report for This Property
The Home Valuation Report is an in-depth analysis detailing your home's value as well as a comparison with similar homes in the area
Home Values in the Area
Average Home Value in this Area
Purchase History
| Date | Buyer | Sale Price | Title Company |
|---|---|---|---|
| House Marydella | -- | None Available | |
| House Laura G | -- | -- | |
| Sanders Harvey L | -- | -- | |
| Ricks Randall Lee | -- | -- |
Source: Public Records
Mortgage History
| Date | Status | Borrower | Loan Amount |
|---|---|---|---|
| Open | House Laura G | $147,200 | |
| Previous Owner | Sanders Harvey L | $141,928 |
Source: Public Records
Tax History Compared to Growth
Tax History
| Year | Tax Paid | Tax Assessment Tax Assessment Total Assessment is a certain percentage of the fair market value that is determined by local assessors to be the total taxable value of land and additions on the property. | Land | Improvement |
|---|---|---|---|---|
| 2025 | $10,268 | $741,810 | $541,650 | $200,160 |
| 2024 | $10,268 | $579,400 | $290,000 | $289,400 |
| 2023 | $10,268 | $510,660 | $260,000 | $250,660 |
| 2022 | $12,003 | $480,060 | $260,000 | $220,060 |
| 2021 | $10,352 | $392,410 | $240,000 | $152,410 |
| 2020 | $10,646 | $392,410 | $240,000 | $152,410 |
| 2019 | $11,165 | $392,410 | $240,000 | $152,410 |
| 2018 | $9,132 | $335,840 | $180,000 | $155,840 |
| 2017 | $8,830 | $324,710 | $180,000 | $144,710 |
| 2016 | $8,830 | $324,710 | $180,000 | $144,710 |
| 2015 | $4,664 | $298,890 | $135,000 | $163,890 |
| 2014 | $4,664 | $265,770 | $100,000 | $165,770 |
Source: Public Records
Map
Nearby Homes
- 6644 Santa Anita Dr
- 6660 Santa Anita Dr
- 6529 Trammel Dr
- 6665 Santa Anita Dr
- 6527 Axton Cir
- 6537 Patrick Dr
- 6811 Patrick Dr
- 6711 Vada Dr
- 6517 Highgate Ln
- 6459 Trammel Dr
- 6802 Vada Dr
- 6611 Highgate Ln
- 6431 Dunstan Ln
- 6717 Pimlico Dr
- 6415 Axton Ln
- 6746 Braeburn Dr
- 6984 Santa Barbara Dr
- 7318 Rockhurst Dr
- 7328 Rockhurst Dr
- 6720 Braeburn Dr
- 6615 Santa Anita Dr
- 6605 Santa Anita Dr
- 6615 Trammel Dr
- 6619 Santa Anita Dr
- 6607 Trammel Dr
- 6612 Santa Anita Dr
- 6606 Santa Anita Dr
- 6622 Santa Anita Dr
- 6625 Santa Anita Dr
- 6566 Axton Ln
- 6561 Trammel Dr
- 6715 Trammel Dr
- 6632 Santa Anita Dr
- 6629 Santa Anita Dr
- 6562 Axton Ln
- 6572 Axton Ln
- 6557 Trammel Dr
- 6719 Trammel Dr
- 6633 Santa Anita Dr
- 6640 Santa Anita Dr