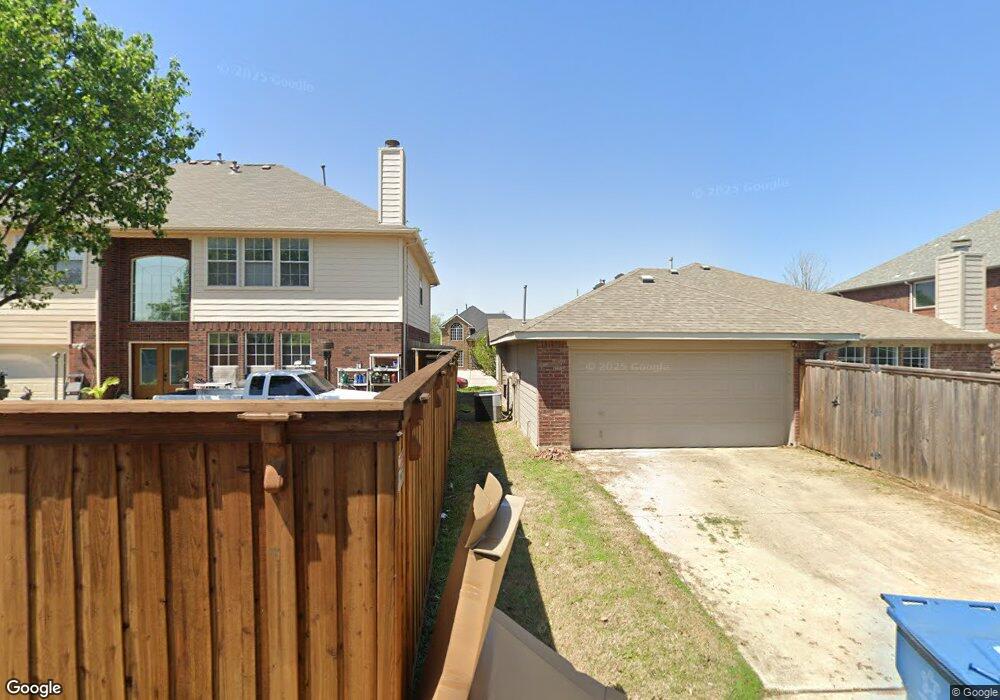
6613 Autumn Trail the Colony, TX 75056
Estimated Value: $507,939 - $565,000
4
Beds
3
Baths
2,747
Sq Ft
$196/Sq Ft
Est. Value
About This Home
This home is located at 6613 Autumn Trail, the Colony, TX 75056 and is currently estimated at $539,235, approximately $196 per square foot. 6613 Autumn Trail is a home located in Denton County with nearby schools including Morningside Elementary School, Griffin Middle School, and The Colony High School.
Ownership History
Date
Name
Owned For
Owner Type
Purchase Details
Closed on
Sep 26, 2008
Sold by
Waweru John K
Bought by
Waithaka Evelyn W
Current Estimated Value
Purchase Details
Closed on
Apr 23, 2003
Sold by
Dillon Robert Keith and Dillon Karen Lea
Bought by
Waweru John K and Waweru Evelyn W
Home Financials for this Owner
Home Financials are based on the most recent Mortgage that was taken out on this home.
Original Mortgage
$155,600
Outstanding Balance
$67,090
Interest Rate
5.8%
Estimated Equity
$472,145
Purchase Details
Closed on
Nov 29, 2001
Sold by
Goodman Family Of Builders Lp
Bought by
Dillon Robert Keith and Dillon Karen Lea
Home Financials for this Owner
Home Financials are based on the most recent Mortgage that was taken out on this home.
Original Mortgage
$157,000
Interest Rate
6.57%
Purchase Details
Closed on
May 2, 2001
Sold by
Lot Lines Ltd
Bought by
Goodman Family Of Builders Lp
Create a Home Valuation Report for This Property
The Home Valuation Report is an in-depth analysis detailing your home's value as well as a comparison with similar homes in the area
Home Values in the Area
Average Home Value in this Area
Purchase History
| Date | Buyer | Sale Price | Title Company |
|---|---|---|---|
| Waithaka Evelyn W | -- | None Available | |
| Waweru John K | -- | -- | |
| Dillon Robert Keith | -- | -- | |
| Goodman Family Of Builders Lp | -- | -- |
Source: Public Records
Mortgage History
| Date | Status | Borrower | Loan Amount |
|---|---|---|---|
| Open | Waweru John K | $155,600 | |
| Previous Owner | Dillon Robert Keith | $157,000 | |
| Closed | Waweru John K | $19,450 | |
| Closed | Waithaka Evelyn W | $0 |
Source: Public Records
Tax History Compared to Growth
Tax History
| Year | Tax Paid | Tax Assessment Tax Assessment Total Assessment is a certain percentage of the fair market value that is determined by local assessors to be the total taxable value of land and additions on the property. | Land | Improvement |
|---|---|---|---|---|
| 2025 | $7,977 | $513,000 | $96,890 | $416,110 |
| 2024 | $7,977 | $488,477 | $96,890 | $411,110 |
| 2023 | $7,528 | $444,070 | $95,028 | $428,972 |
| 2022 | $8,475 | $403,700 | $100,478 | $339,522 |
| 2021 | $8,174 | $367,000 | $68,182 | $298,818 |
| 2020 | $7,446 | $335,000 | $68,182 | $266,818 |
| 2019 | $7,575 | $330,000 | $68,182 | $261,818 |
| 2018 | $7,185 | $311,000 | $68,182 | $242,818 |
| 2017 | $7,186 | $307,629 | $68,182 | $245,803 |
| 2016 | $6,755 | $279,663 | $48,308 | $237,753 |
| 2015 | $5,376 | $254,239 | $48,308 | $207,080 |
| 2014 | $5,376 | $231,126 | $48,308 | $182,818 |
| 2013 | -- | $215,204 | $48,308 | $166,896 |
Source: Public Records
Map
Nearby Homes
- 6621 Autumn Trail
- 7020 Northpointe Ct
- 5841 Baker Dr
- 6605 Oxford Ln
- 5953 Snow Creek Dr
- 5912 Madison Dr
- 4603 Warwick Ln
- 5728 Big River Dr
- 5621 Woodlands Dr
- 5617 Woodlands Dr
- 5613 Woodlands Dr
- 5713 Green Hollow Ln
- 5632 Westwood Ln
- 5860 Stone Mountain Rd
- 5633 Westwood Ln
- 5856 Clearwater Dr
- 4647 Pine Valley Dr
- 5612 Pearce St
- 6321 Cedar Falls Dr
- 4601 Firestone Dr
- 6617 Autumn Trail
- 6609 Autumn Trail
- 6605 Autumn Trail
- 6612 Autumn Trail
- 6608 Autumn Trail
- 6616 Autumn Trail
- 6612 Brentwood Ln
- 6616 Brentwood Ln
- 6604 Autumn Trail
- 6625 Autumn Trail
- 6608 Brentwood Ln
- 6601 Autumn Trail
- 6620 Autumn Trail
- 6620 Brentwood Ln
- 6604 Brentwood Ln
- 6600 Autumn Trail
- 6629 Autumn Trail
- 6624 Brentwood Ln
- 6624 Autumn Trail
- 6600 Brentwood Ln