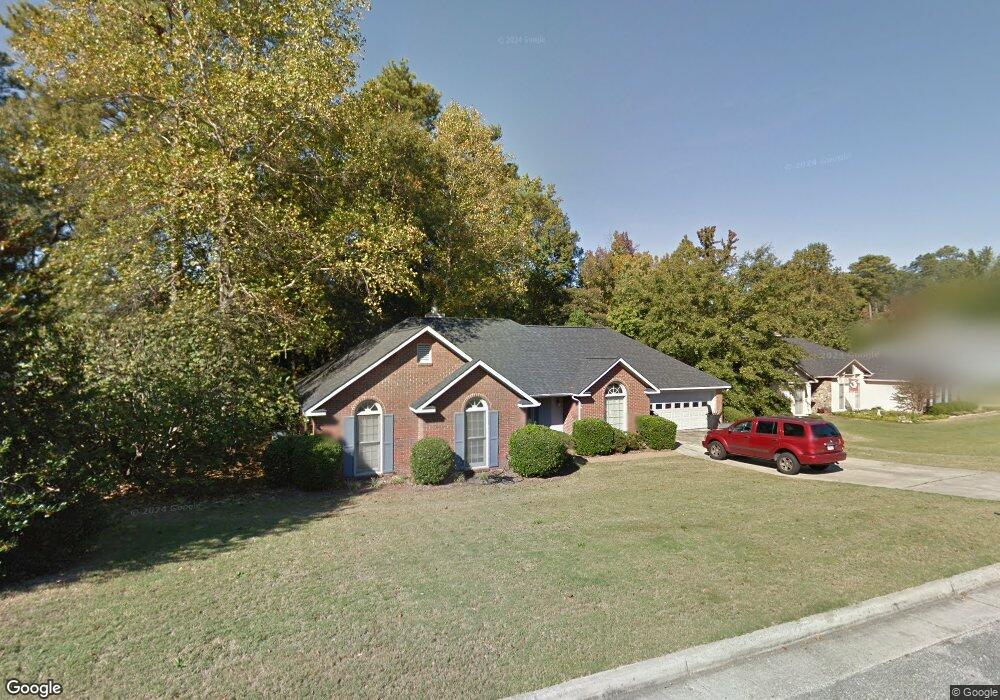
6613 Hillbrook Ave Columbus, GA 31909
Northern Columbus NeighborhoodEstimated Value: $293,090 - $339,000
3
Beds
3
Baths
2,312
Sq Ft
$139/Sq Ft
Est. Value
About This Home
This home is located at 6613 Hillbrook Ave, Columbus, GA 31909 and is currently estimated at $321,023, approximately $138 per square foot. 6613 Hillbrook Ave is a home located in Muscogee County with nearby schools including Blanchard Elementary School, Veterans Memorial Middle School, and Shaw High School.
Ownership History
Date
Name
Owned For
Owner Type
Purchase Details
Closed on
Aug 29, 2017
Sold by
T
Bought by
Morris Mitchell L
Current Estimated Value
Home Financials for this Owner
Home Financials are based on the most recent Mortgage that was taken out on this home.
Original Mortgage
$192,000
Outstanding Balance
$160,463
Interest Rate
3.93%
Mortgage Type
VA
Estimated Equity
$160,560
Purchase Details
Closed on
Jan 3, 2017
Sold by
Williams Michael E
Bought by
T & H Mitchell Properties Delawa
Create a Home Valuation Report for This Property
The Home Valuation Report is an in-depth analysis detailing your home's value as well as a comparison with similar homes in the area
Home Values in the Area
Average Home Value in this Area
Purchase History
| Date | Buyer | Sale Price | Title Company |
|---|---|---|---|
| Morris Mitchell L | $192,000 | -- | |
| T & H Mitchell Properties Delawa | $96,100 | -- |
Source: Public Records
Mortgage History
| Date | Status | Borrower | Loan Amount |
|---|---|---|---|
| Open | Morris Mitchell L | $192,000 |
Source: Public Records
Tax History Compared to Growth
Tax History
| Year | Tax Paid | Tax Assessment Tax Assessment Total Assessment is a certain percentage of the fair market value that is determined by local assessors to be the total taxable value of land and additions on the property. | Land | Improvement |
|---|---|---|---|---|
| 2025 | -- | $97,552 | $13,404 | $84,148 |
| 2024 | -- | $97,552 | $13,404 | $84,148 |
| 2023 | $2,556 | $97,552 | $13,404 | $84,148 |
| 2022 | $2,556 | $76,284 | $13,404 | $62,880 |
| 2021 | $2,549 | $75,816 | $13,404 | $62,412 |
| 2020 | $2,550 | $75,816 | $13,404 | $62,412 |
| 2019 | $2,559 | $75,816 | $13,404 | $62,412 |
| 2018 | $2,559 | $75,816 | $13,404 | $62,412 |
| 2017 | $3,100 | $75,436 | $13,404 | $62,032 |
| 2016 | $1,516 | $94,680 | $10,400 | $84,280 |
| 2015 | $1,521 | $94,680 | $10,400 | $84,280 |
| 2014 | $1,526 | $94,680 | $10,400 | $84,280 |
| 2013 | -- | $94,680 | $10,400 | $84,280 |
Source: Public Records
Map
Nearby Homes
- 22 Nettle Ct
- 3919 Gray Fox Dr
- 6813 Panstone Dr
- 3732 Arrel Dr
- 6910 Cinnamon Loop
- 3824 Lyn Dr
- 3725 Nutmeg Dr
- 2 Nightwind Ct
- 6717 Moon Cir
- 6200 Karen Ct
- 6221 Charing Dr
- 3204 Weems Rd
- 3325 N North Quay Dr
- 4245 N Oaks Dr
- 6138 Seaton Dr
- 6104 Candlestick Loop
- 4417 Sibley St
- 3120 Weems Rd
- 4036 Wilbur Dr
- 4121 Wilbur Dr
- 6607 Hillbrook Ave
- 6617 Hillbrook Ave
- 6612 Lorna Dr
- 6606 Lorna Dr
- 6620 Lorna Dr
- 6608 Hillbrook Ave
- 6600 Lorna Dr
- 3667 Gray Fox Dr
- 6627 Springlake Dr
- 6623 Hillbrook Ave
- 6628 Lorna Dr
- 3741 Gray Fox Dr
- 6622 Hillbrook Ave
- 6626 Hillbrook Ave
- 6632 Springlake Dr
- 6615 Lorna Dr
- 6638 Lorna Dr
- 6607 Lorna Dr
- 0 Lorna Dr
- 3658 Gray Fox Dr