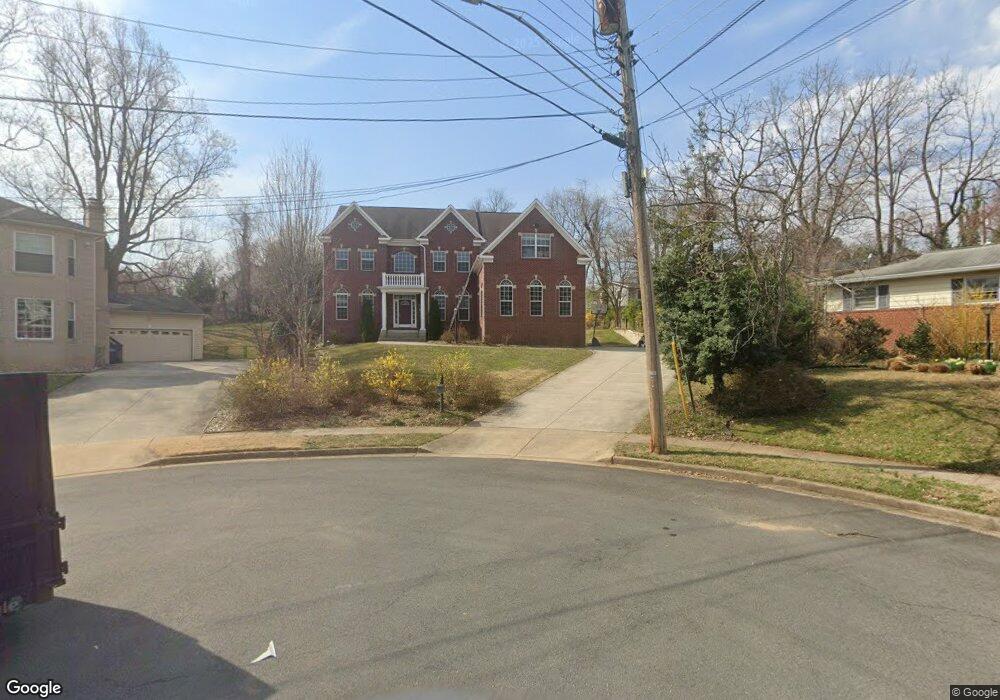
6613 Rockmont Ct Falls Church, VA 22043
Estimated Value: $1,607,000 - $2,668,000
3
Beds
2
Baths
5,355
Sq Ft
$417/Sq Ft
Est. Value
About This Home
This home is located at 6613 Rockmont Ct, Falls Church, VA 22043 and is currently estimated at $2,230,439, approximately $416 per square foot. 6613 Rockmont Ct is a home located in Fairfax County with nearby schools including Haycock Elementary School, Longfellow Middle School, and St. James Catholic School.
Ownership History
Date
Name
Owned For
Owner Type
Purchase Details
Closed on
Mar 24, 2010
Sold by
Kirkpatrick Gregory Scott
Bought by
Cheng Ningjiang and Luo Xiaodong
Current Estimated Value
Home Financials for this Owner
Home Financials are based on the most recent Mortgage that was taken out on this home.
Original Mortgage
$895,300
Outstanding Balance
$594,571
Interest Rate
5.02%
Mortgage Type
New Conventional
Estimated Equity
$1,635,868
Purchase Details
Closed on
Mar 23, 2001
Sold by
Earley Walter L
Bought by
Kirkpatrick Gregory S
Home Financials for this Owner
Home Financials are based on the most recent Mortgage that was taken out on this home.
Original Mortgage
$208,000
Interest Rate
6.93%
Purchase Details
Closed on
Dec 23, 1997
Sold by
Reddick Walter L and Reddick Rebecca A
Bought by
Walter L Reddick Trust
Create a Home Valuation Report for This Property
The Home Valuation Report is an in-depth analysis detailing your home's value as well as a comparison with similar homes in the area
Home Values in the Area
Average Home Value in this Area
Purchase History
| Date | Buyer | Sale Price | Title Company |
|---|---|---|---|
| Cheng Ningjiang | $560,000 | -- | |
| Kirkpatrick Gregory S | $260,000 | -- | |
| Walter L Reddick Trust | -- | -- |
Source: Public Records
Mortgage History
| Date | Status | Borrower | Loan Amount |
|---|---|---|---|
| Open | Cheng Ningjiang | $895,300 | |
| Previous Owner | Kirkpatrick Gregory S | $208,000 |
Source: Public Records
Tax History Compared to Growth
Tax History
| Year | Tax Paid | Tax Assessment Tax Assessment Total Assessment is a certain percentage of the fair market value that is determined by local assessors to be the total taxable value of land and additions on the property. | Land | Improvement |
|---|---|---|---|---|
| 2025 | $21,901 | $1,874,550 | $626,000 | $1,248,550 |
| 2024 | $21,901 | $1,806,680 | $626,000 | $1,180,680 |
| 2023 | $19,062 | $1,612,810 | $504,000 | $1,108,810 |
| 2022 | $18,434 | $1,539,540 | $445,000 | $1,094,540 |
| 2021 | $17,484 | $1,461,280 | $445,000 | $1,016,280 |
| 2020 | $16,958 | $1,405,520 | $436,000 | $969,520 |
| 2019 | $16,820 | $1,417,130 | $436,000 | $981,130 |
| 2018 | $17,883 | $1,344,590 | $419,000 | $925,590 |
| 2017 | $15,822 | $1,336,300 | $417,000 | $919,300 |
| 2016 | $15,681 | $1,327,200 | $417,000 | $910,200 |
| 2015 | $14,889 | $1,307,200 | $397,000 | $910,200 |
| 2014 | $14,445 | $1,270,970 | $389,000 | $881,970 |
Source: Public Records
Map
Nearby Homes
- 6610 Quinten St
- 6609 Rockmont Ct
- 6616 Kirby Ct
- 6545 Placid St
- 6607 Midhill Place
- 2125 Hilltop Place
- 2005 Highboro Way
- 6449 Orland St
- 2221 Orchid Dr
- 6616 Fisher Ave
- 6613 Fisher Ave
- 2115 Natahoa Ct
- 1904 Lamson Place
- 6712 Moly Dr
- 6601 Gordon Ave
- 6511 Ivy Hill Dr
- 2123 Natahoa Ct
- 2231 N Tuckahoe St
- 2300 Meridian St
- 2302 Westmoreland St
- 6611 Rockmont Ct
- 6614 Rockmont Ct
- 2047 Westmoreland St
- 6612 Quinten St
- 2049 Westmoreland St
- 2045 Westmoreland St
- 2051 Westmoreland St
- 6612 Rockmont Ct
- 6608 Quinten St
- 2043 Westmoreland St
- 6614 Quinten St
- 6610 Rockmont Ct
- 2101 Westmoreland St
- 6607 Rockmont Ct
- 2041 Westmoreland St
- 6606 Quinten St
- 2048 Westmoreland St
- 6608 Rockmont Ct
- 2103 Westmoreland St
- 2037 Westmoreland St