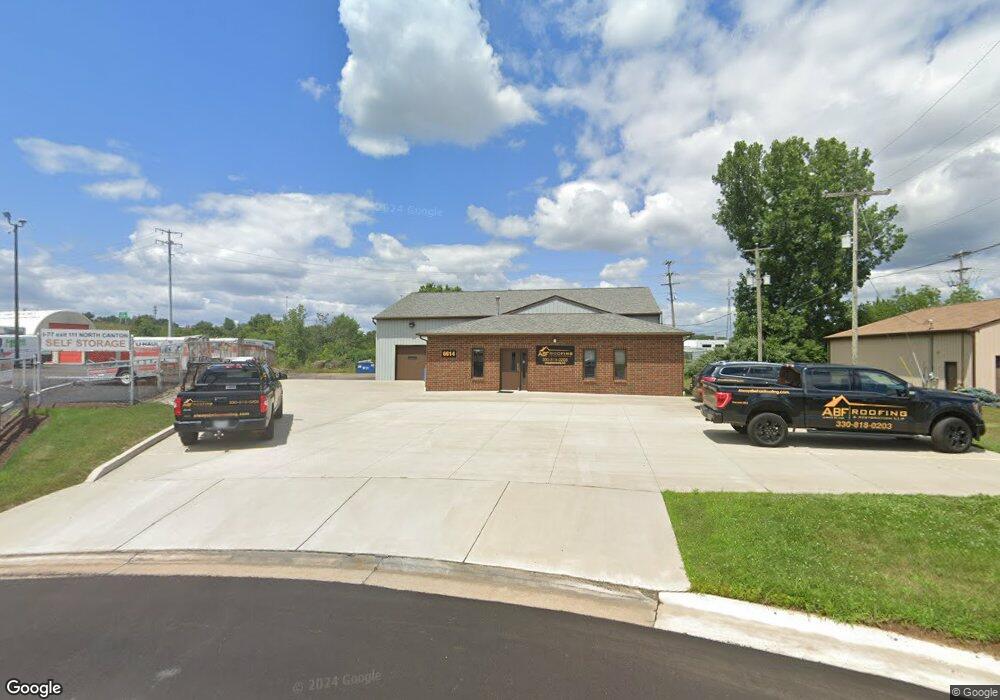
6614 Greenfield Cir NW North Canton, OH 44720
Estimated Value: $588,017
--
Bed
2
Baths
4,096
Sq Ft
$144/Sq Ft
Est. Value
About This Home
This home is located at 6614 Greenfield Cir NW, North Canton, OH 44720 and is currently estimated at $588,017, approximately $143 per square foot. 6614 Greenfield Cir NW is a home located in Stark County with nearby schools including Lake Cable Elementary School, Jackson Memorial Middle School, and Jackson High School.
Ownership History
Date
Name
Owned For
Owner Type
Purchase Details
Closed on
Apr 27, 2022
Sold by
Race Holdings Llc
Bought by
Abf Jackson Llc
Current Estimated Value
Home Financials for this Owner
Home Financials are based on the most recent Mortgage that was taken out on this home.
Original Mortgage
$398,000
Outstanding Balance
$352,357
Interest Rate
4.16%
Mortgage Type
Credit Line Revolving
Estimated Equity
$235,660
Purchase Details
Closed on
Feb 21, 2020
Sold by
Shah Harsha and Shah Pravin
Bought by
Race Holdings Llc
Home Financials for this Owner
Home Financials are based on the most recent Mortgage that was taken out on this home.
Original Mortgage
$344,000
Interest Rate
3.6%
Mortgage Type
Future Advance Clause Open End Mortgage
Purchase Details
Closed on
May 13, 2000
Sold by
Pravin Shah and Pravin Harsha P
Bought by
Shah Harsha and The Harsha Shah Revocable Trust
Purchase Details
Closed on
Feb 1, 1990
Create a Home Valuation Report for This Property
The Home Valuation Report is an in-depth analysis detailing your home's value as well as a comparison with similar homes in the area
Home Values in the Area
Average Home Value in this Area
Purchase History
| Date | Buyer | Sale Price | Title Company |
|---|---|---|---|
| Abf Jackson Llc | -- | None Listed On Document | |
| Race Holdings Llc | $430,000 | None Available | |
| Shah Harsha | -- | -- | |
| -- | $35,000 | -- |
Source: Public Records
Mortgage History
| Date | Status | Borrower | Loan Amount |
|---|---|---|---|
| Open | Abf Jackson Llc | $398,000 | |
| Previous Owner | Race Holdings Llc | $344,000 |
Source: Public Records
Tax History Compared to Growth
Tax History
| Year | Tax Paid | Tax Assessment Tax Assessment Total Assessment is a certain percentage of the fair market value that is determined by local assessors to be the total taxable value of land and additions on the property. | Land | Improvement |
|---|---|---|---|---|
| 2025 | -- | $137,590 | $75,640 | $61,950 |
| 2024 | $15,664 | $137,590 | $75,640 | $61,950 |
| 2023 | $15,257 | $150,500 | $55,160 | $95,340 |
| 2022 | $8,606 | $150,500 | $55,160 | $95,340 |
| 2021 | $8,685 | $150,500 | $55,160 | $95,340 |
| 2020 | $6,057 | $100,420 | $55,160 | $45,260 |
| 2019 | $2,866 | $100,430 | $55,160 | $45,270 |
| 2018 | $6,032 | $100,430 | $55,160 | $45,270 |
| 2017 | $5,702 | $86,540 | $43,230 | $43,310 |
| 2016 | $5,669 | $86,540 | $43,230 | $43,310 |
| 2015 | $5,733 | $86,540 | $43,230 | $43,310 |
| 2014 | $368 | $92,550 | $46,240 | $46,310 |
| 2013 | $3,154 | $92,550 | $46,240 | $46,310 |
Source: Public Records
Map
Nearby Homes
- 1246 W Maple St Unit 4A
- 1171 Terrace Rd NW
- 0 W Maple St Unit 5135089
- 1314 Bel Air Dr NW
- 6285 Cherry Blossom Cir NW
- 1015 Lois Ave NW
- 727 Lorena St SW
- 6851 Lake Cable Ave NW
- Powell Plan at Eastlake Meadows
- 6266 Cherry Blossom Cir NW
- Saint Lawrence Estate Plan at Eastlake Meadows
- Versailles Estate Plan at Eastlake Meadows
- Savannah Estate Plan at Eastlake Meadows
- Cumberland Estate Plan at Eastlake Meadows
- Oak Park Estate Plan at Eastlake Meadows
- 303 W Park Rd NW
- 5437 Portage St NW
- 201 Parkview Ave NW
- 1276 Linwood Ave SW
- 742 Portage St NW
- 6614 Greenfield Dr NW
- 6624 Greenfield Cir NW
- 6535 Promler St NW
- 6725 Promway Ave NW
- 6725 Promway Ave NW Unit 5
- 6725 Promway Ave NW Unit 11
- 6725 Promway Ave NW Unit 3
- 6725 Promway Ave NW Unit 22
- 6725 Promway Ave NW Unit 20
- 6725 Promway Ave NW Unit 16, 18
- 6725 Promway Ave NW Unit 14
- 6725 Promway Ave NW Unit 13, 15, 17
- 6669 Freedom Ave NW
- 4314 Millwood St NW
- 6821 Promway Ave NW
- 4345 Millwood St NW
- 4331 Millwood St NW
- 4430 Portage St NW
- 4317 Millwood St NW
- 6855 Promway Ave NW