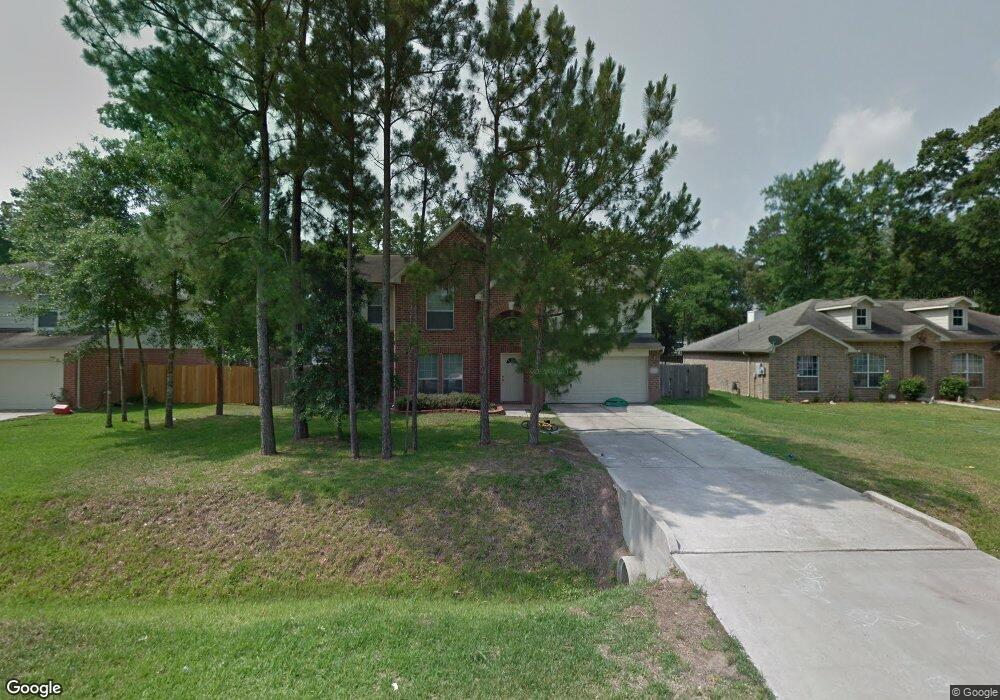
6615 Hayden Dr Magnolia, TX 77354
Estimated Value: $349,245 - $376,000
--
Bed
1
Bath
2,592
Sq Ft
$139/Sq Ft
Est. Value
About This Home
This home is located at 6615 Hayden Dr, Magnolia, TX 77354 and is currently estimated at $361,311, approximately $139 per square foot. 6615 Hayden Dr is a home located in Montgomery County with nearby schools including Tom R. Ellisor Elementary School, Bear Branch Junior High School, and Magnolia High School.
Ownership History
Date
Name
Owned For
Owner Type
Purchase Details
Closed on
Apr 30, 2013
Sold by
Allen Andrea
Bought by
Allen Joel
Current Estimated Value
Purchase Details
Closed on
Mar 31, 2003
Sold by
Royce Homes Lp
Bought by
Allen Joel D and Allen Andrea J
Home Financials for this Owner
Home Financials are based on the most recent Mortgage that was taken out on this home.
Original Mortgage
$148,600
Outstanding Balance
$63,650
Interest Rate
5.71%
Mortgage Type
VA
Estimated Equity
$297,661
Purchase Details
Closed on
Nov 5, 2002
Sold by
Stoecker Corp
Bought by
Royce Homes Lp
Home Financials for this Owner
Home Financials are based on the most recent Mortgage that was taken out on this home.
Original Mortgage
$25,000,000
Interest Rate
5.95%
Purchase Details
Closed on
Sep 1, 1982
Bought by
Allen Joel D
Create a Home Valuation Report for This Property
The Home Valuation Report is an in-depth analysis detailing your home's value as well as a comparison with similar homes in the area
Home Values in the Area
Average Home Value in this Area
Purchase History
| Date | Buyer | Sale Price | Title Company |
|---|---|---|---|
| Allen Joel | -- | None Available | |
| Allen Joel D | -- | Stewart Title | |
| Royce Homes Lp | -- | Stewart Title Company | |
| Allen Joel D | -- | -- |
Source: Public Records
Mortgage History
| Date | Status | Borrower | Loan Amount |
|---|---|---|---|
| Open | Allen Joel D | $148,600 | |
| Previous Owner | Royce Homes Lp | $25,000,000 | |
| Closed | Allen Joel | $0 |
Source: Public Records
Tax History Compared to Growth
Tax History
| Year | Tax Paid | Tax Assessment Tax Assessment Total Assessment is a certain percentage of the fair market value that is determined by local assessors to be the total taxable value of land and additions on the property. | Land | Improvement |
|---|---|---|---|---|
| 2025 | $4,129 | $334,431 | $58,000 | $276,431 |
| 2024 | $4,129 | $341,825 | -- | -- |
| 2023 | $3,655 | $310,750 | $58,000 | $307,160 |
| 2022 | $4,985 | $282,500 | $45,900 | $287,170 |
| 2021 | $4,774 | $256,820 | $42,500 | $214,320 |
| 2020 | $5,103 | $252,180 | $36,000 | $216,180 |
| 2019 | $4,791 | $237,910 | $36,000 | $201,910 |
| 2018 | $4,108 | $221,960 | $12,360 | $209,600 |
| 2017 | $4,707 | $221,960 | $12,360 | $209,600 |
| 2016 | $4,567 | $215,370 | $12,360 | $204,990 |
| 2015 | $3,604 | $195,790 | $12,360 | $192,020 |
| 2014 | $3,604 | $177,990 | $12,360 | $174,790 |
Source: Public Records
Map
Nearby Homes
- 6626 Grant Dr
- 723 Hinsdale
- 6910 Woodland Oaks
- 906 Wiley Dr
- 6846 Durango Creek Dr
- 6718 Durango Creek Dr
- 6706 Durango Creek Dr
- 7002 Durango Creek Dr
- 6818 Woodland Oaks
- 1411 Honea Egypt Rd
- 6902 Woodland Oaks
- 6906 Grant Dr
- 6422 Sugar Bush Dr
- 1518 Honea Egypt Rd
- 7010 Durango Dr
- 906 Weeping Willow Way
- 7022 Dillon Dr
- 7203 Cool Springs Ct
- 7119 Durango Dr
- 503 Weisinger Dr
- 6611 Hayden Dr
- 6619 Hayden Dr
- 6607 Hayden Dr
- 6623 Hayden Dr
- 6614 Durango Dr
- 6610 Durango Dr
- 6618 Durango Dr
- 6606 Durango Dr
- 6622 Durango Dr
- 6603 Hayden Dr
- 6627 Hayden Dr
- 6614 Hayden Dr
- 6610 Hayden Dr
- 6618 Hayden Dr
- 6606 Hayden Dr
- 6622 Hayden Dr
- 6626 Durango Dr
- 6602 Durango Dr
- 6535 Hayden Dr
- 6631 Hayden Dr