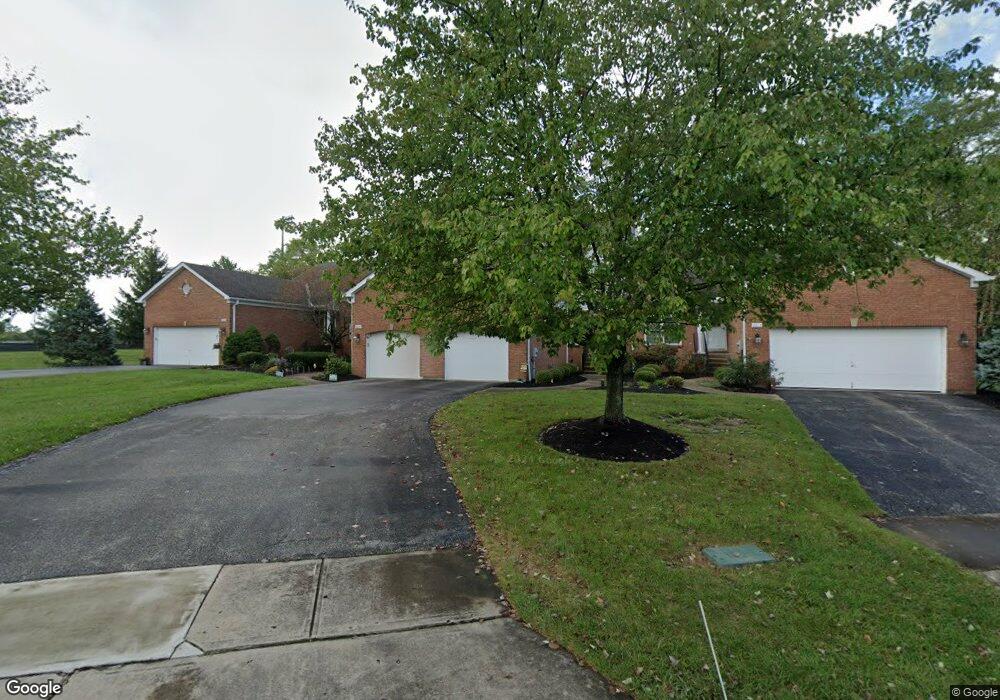
6616 Spindlewick Ln Cincinnati, OH 45230
Mount Washington NeighborhoodEstimated Value: $338,000 - $381,000
3
Beds
3
Baths
2,455
Sq Ft
$148/Sq Ft
Est. Value
About This Home
This home is located at 6616 Spindlewick Ln, Cincinnati, OH 45230 and is currently estimated at $364,251, approximately $148 per square foot. 6616 Spindlewick Ln is a home located in Hamilton County with nearby schools including Mt. Washington Elementary School, Clark Montessori High School, and Shroder High School.
Ownership History
Date
Name
Owned For
Owner Type
Purchase Details
Closed on
Jul 28, 2010
Sold by
Baade Heather and Howe Eric T
Bought by
Rincones Pamela
Current Estimated Value
Home Financials for this Owner
Home Financials are based on the most recent Mortgage that was taken out on this home.
Original Mortgage
$153,000
Outstanding Balance
$100,377
Interest Rate
4.7%
Mortgage Type
Unknown
Estimated Equity
$263,874
Purchase Details
Closed on
Jun 25, 2004
Sold by
Riggs Anne R
Bought by
Baade Heather
Purchase Details
Closed on
Nov 29, 1996
Sold by
Kindt Carole Grove and Grove Carol L
Bought by
Riggs Anne R
Home Financials for this Owner
Home Financials are based on the most recent Mortgage that was taken out on this home.
Original Mortgage
$97,400
Interest Rate
7.85%
Create a Home Valuation Report for This Property
The Home Valuation Report is an in-depth analysis detailing your home's value as well as a comparison with similar homes in the area
Home Values in the Area
Average Home Value in this Area
Purchase History
| Date | Buyer | Sale Price | Title Company |
|---|---|---|---|
| Rincones Pamela | $170,000 | Ltoc | |
| Baade Heather | $195,000 | -- | |
| Riggs Anne R | $129,900 | -- |
Source: Public Records
Mortgage History
| Date | Status | Borrower | Loan Amount |
|---|---|---|---|
| Open | Rincones Pamela | $153,000 | |
| Previous Owner | Riggs Anne R | $97,400 |
Source: Public Records
Tax History
| Year | Tax Paid | Tax Assessment Tax Assessment Total Assessment is a certain percentage of the fair market value that is determined by local assessors to be the total taxable value of land and additions on the property. | Land | Improvement |
|---|---|---|---|---|
| 2025 | $4,888 | $79,398 | $14,000 | $65,398 |
| 2024 | $4,739 | $79,398 | $14,000 | $65,398 |
| 2023 | $4,846 | $79,398 | $14,000 | $65,398 |
| 2022 | $4,681 | $68,796 | $13,860 | $54,936 |
| 2021 | $4,506 | $68,796 | $13,860 | $54,936 |
| 2020 | $4,638 | $68,796 | $13,860 | $54,936 |
| 2019 | $4,609 | $62,542 | $12,600 | $49,942 |
| 2018 | $4,616 | $62,542 | $12,600 | $49,942 |
| 2017 | $4,385 | $62,542 | $12,600 | $49,942 |
| 2016 | $4,273 | $60,096 | $12,373 | $47,723 |
| 2015 | $3,852 | $60,096 | $12,373 | $47,723 |
| 2014 | $3,880 | $60,096 | $12,373 | $47,723 |
| 2013 | $3,909 | $59,500 | $12,250 | $47,250 |
Source: Public Records
Map
Nearby Homes
- 2140 Trailwood Dr
- 1939 Lady Ellen Dr
- 6604 Ambar Ave
- 1627 Alcor Terrace
- 2133 Ronaldson Ave
- 6542 Rainbow Ln
- 1944 Rockland Ave
- 2412 Findlater Ct
- 1741 Mears Ave
- 6253 Sturdy Ave
- 1454 Antoinette Ave
- 7061 Clough Pike
- 6122 Corbly Rd
- 6519 Copperleaf Ln
- 6123 Cambridge Ave
- 1361 Bursal Ave
- 2111 Sutton Ave
- 2121 Sutton Ave
- 6050 Colter Ave
- 1305 Bursal Ave
- 6620 Spindlewick Ln
- 6612 Spindlewick Ln
- 6624 Spindlewick Ln
- 6600 Spindlewick Ln
- 6634 Spindlewick Ln
- 6625 Spindlewick Ln
- 6615 Spindlewick Ln
- 6645 Spindlewick Ln
- 6598 Spindlewick Ln
- 6611 Spindlewick Ln
- 6638 Spindlewick Ln
- 6642 Spindlewick Ln
- 6609 Spindlewick Ln
- 6655 Spindlewick Ln
- 6605 Spindlewick Ln
- 6648 Spindlewick Ln
- 6596 Spindlewick Ln
- 6665 Spindlewick Ln
- 6669 Spindlewick Ln
- 2060 Autumn Hill Ct
Your Personal Tour Guide
Ask me questions while you tour the home.