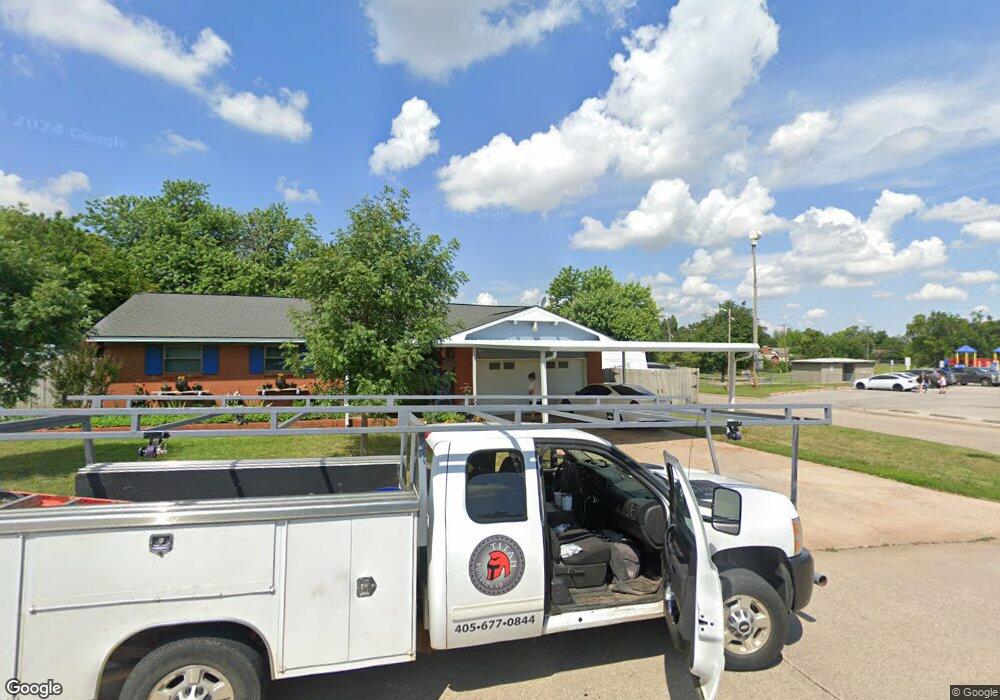
6617 Cherokee Dr Warr Acres, OK 73132
Estimated Value: $536,000 - $631,628
3
Beds
3
Baths
2,937
Sq Ft
$199/Sq Ft
Est. Value
About This Home
This home is located at 6617 Cherokee Dr, Warr Acres, OK 73132 and is currently estimated at $583,907, approximately $198 per square foot. 6617 Cherokee Dr is a home located in Oklahoma County with nearby schools including McLoud Elementary School, McLoud Intermediate School, and McLoud Junior High School.
Ownership History
Date
Name
Owned For
Owner Type
Purchase Details
Closed on
Jun 12, 2023
Sold by
Salesberry Ronald H and Salesberry Krista L
Bought by
Larman Natalie and Larman Seth
Current Estimated Value
Home Financials for this Owner
Home Financials are based on the most recent Mortgage that was taken out on this home.
Original Mortgage
$370,000
Outstanding Balance
$360,178
Interest Rate
6.43%
Mortgage Type
New Conventional
Estimated Equity
$223,729
Purchase Details
Closed on
Mar 24, 2010
Sold by
Leatherwood Don and Leatherwood Gail
Bought by
Freeman Phillip J and Goodson Judy C
Home Financials for this Owner
Home Financials are based on the most recent Mortgage that was taken out on this home.
Original Mortgage
$240,000
Interest Rate
4.96%
Mortgage Type
New Conventional
Purchase Details
Closed on
Jan 22, 2008
Sold by
Bear Ridge Inc
Bought by
Leatherwood Don and Leatherwood Gail
Create a Home Valuation Report for This Property
The Home Valuation Report is an in-depth analysis detailing your home's value as well as a comparison with similar homes in the area
Home Values in the Area
Average Home Value in this Area
Purchase History
| Date | Buyer | Sale Price | Title Company |
|---|---|---|---|
| Larman Natalie | $570,000 | Chicago Title | |
| Freeman Phillip J | $300,000 | American Eagle Title Ins Co | |
| Leatherwood Don | $38,500 | Lawyers Title Of Ok City Inc |
Source: Public Records
Mortgage History
| Date | Status | Borrower | Loan Amount |
|---|---|---|---|
| Open | Larman Natalie | $370,000 | |
| Previous Owner | Freeman Phillip J | $240,000 |
Source: Public Records
Tax History Compared to Growth
Tax History
| Year | Tax Paid | Tax Assessment Tax Assessment Total Assessment is a certain percentage of the fair market value that is determined by local assessors to be the total taxable value of land and additions on the property. | Land | Improvement |
|---|---|---|---|---|
| 2024 | -- | $61,930 | $3,535 | $58,395 |
| 2023 | $0 | $41,252 | $3,444 | $37,808 |
| 2022 | $0 | $40,051 | $6,940 | $33,111 |
| 2021 | $0 | $38,885 | $7,709 | $31,176 |
| 2020 | $0 | $38,500 | $7,709 | $30,791 |
| 2019 | $2,938 | $38,280 | $7,709 | $30,571 |
| 2018 | $0 | $38,280 | $0 | $0 |
| 2017 | $0 | $38,279 | $5,187 | $33,092 |
| 2016 | $2,938 | $28,049 | $5,187 | $22,862 |
| 2015 | $3,343 | $31,182 | $5,187 | $25,995 |
| 2014 | $3,449 | $32,290 | $4,718 | $27,572 |
Source: Public Records
Map
Nearby Homes
- 0 SE Corner Se 59th Peebly St Unit 1194088
- 17400 Pantera Ave
- 5900 Permian Dr
- 5701 Sunset Ridge
- 5520 Sunset Ridge Rd
- 11600 S Triple X Rd
- 6301 S Triple X Rd
- 7100 Marianne Rd
- 0000 S Triple X Rd
- 8300 Sowell Rd
- 5400 S Triple X Rd
- 21962 SE 44th St
- 16315 SE 59th St
- 18725 Red Oak Dr
- 4400 S Triple X Rd
- 4116 Maxine Dr
- 18220 SE 95th St
- 4708 Sandy Oak Ln
- 17903 W Blue Ridge Road Flat W
- 4230 Sundance Ln
- 6617 Cherokee Grove Ct
- 17705 SE 66th St
- 6616 Cherokee Grove Ct
- 6601 Cherokee Grove Ct
- 6608 Cherokee Grove Ct
- 6600 Cherokee Grove Ct
- 6508 Cherokee Grove Ct
- 6501 Cherokee Grove Ct
- 6500 Cherokee Dr
- 6409 Cherokee Grove Ct
- 6400 Cherokee Dr
- 17500 SE 59th St
- 6801 S Peebly Rd
- 6801 S Peebly Rd
- 6701 S Peebly Rd
- 6800 S Peebly Rd
- 6508 S Peebly Rd
- 6600 S Peebly Rd
- 6501 S Peebly Rd
- 6404 S Peebly Rd