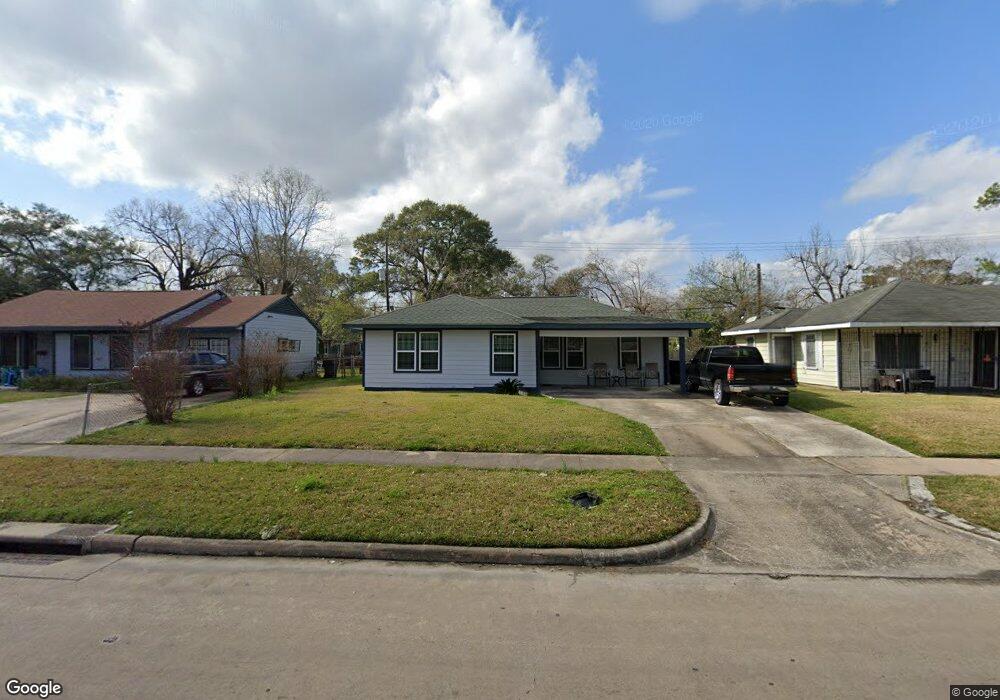
6618 Tierwester St Houston, TX 77021
OST-South Union NeighborhoodEstimated Value: $208,000 - $279,000
3
Beds
2
Baths
1,895
Sq Ft
$131/Sq Ft
Est. Value
About This Home
This home is located at 6618 Tierwester St, Houston, TX 77021 and is currently estimated at $247,381, approximately $130 per square foot. 6618 Tierwester St is a home located in Harris County with nearby schools including Thompson Elementary School, Cullen Middle School, and Yates High School.
Ownership History
Date
Name
Owned For
Owner Type
Purchase Details
Closed on
Aug 12, 2014
Sold by
Flowers Lakeisha
Bought by
Eans David Clifton
Current Estimated Value
Home Financials for this Owner
Home Financials are based on the most recent Mortgage that was taken out on this home.
Original Mortgage
$32,619
Outstanding Balance
$10,556
Interest Rate
4.15%
Mortgage Type
New Conventional
Estimated Equity
$236,825
Purchase Details
Closed on
Mar 2, 2007
Sold by
Davis Sherri M
Bought by
Eans David C
Home Financials for this Owner
Home Financials are based on the most recent Mortgage that was taken out on this home.
Original Mortgage
$34,200
Interest Rate
6.32%
Mortgage Type
Purchase Money Mortgage
Purchase Details
Closed on
Oct 14, 2002
Sold by
Davis Percy Leon and Richard Gladys
Bought by
Davis Sherri M
Create a Home Valuation Report for This Property
The Home Valuation Report is an in-depth analysis detailing your home's value as well as a comparison with similar homes in the area
Home Values in the Area
Average Home Value in this Area
Purchase History
| Date | Buyer | Sale Price | Title Company |
|---|---|---|---|
| Eans David Clifton | -- | Veritas Title Partners | |
| Eans David C | -- | Esquire Title | |
| Davis Sherri M | -- | -- |
Source: Public Records
Mortgage History
| Date | Status | Borrower | Loan Amount |
|---|---|---|---|
| Open | Eans David Clifton | $32,619 | |
| Previous Owner | Eans David C | $34,200 |
Source: Public Records
Tax History Compared to Growth
Tax History
| Year | Tax Paid | Tax Assessment Tax Assessment Total Assessment is a certain percentage of the fair market value that is determined by local assessors to be the total taxable value of land and additions on the property. | Land | Improvement |
|---|---|---|---|---|
| 2025 | $2,544 | $230,515 | $113,925 | $116,590 |
| 2024 | $2,544 | $203,481 | $109,043 | $94,438 |
| 2023 | $2,544 | $282,542 | $104,160 | $178,382 |
| 2022 | $4,335 | $220,340 | $84,630 | $135,710 |
| 2021 | $4,171 | $200,307 | $45,570 | $154,737 |
| 2020 | $3,940 | $166,421 | $45,570 | $120,851 |
| 2019 | $3,743 | $147,910 | $35,805 | $112,105 |
| 2018 | $2,537 | $139,559 | $29,295 | $110,264 |
| 2017 | $2,029 | $84,568 | $29,295 | $55,273 |
| 2016 | $1,844 | $72,944 | $19,530 | $53,414 |
| 2015 | $1,587 | $68,989 | $17,903 | $51,086 |
| 2014 | $1,587 | $61,729 | $17,903 | $43,826 |
Source: Public Records
Map
Nearby Homes
- 6617 Winton St
- 3618 Zephyr St
- 3614 Cosby St
- 6702 Tierwester St
- 6658 Stearns St
- 6653 Lozier St
- 3630 Alsace St
- 6712 Winton St
- 3627 Zephyr St
- 6714 Winton St
- 6350 Culberson St
- 6348 Culberson St
- 3519 Old Spanish Trail
- 6411 Illinois St
- 3719 Zephyr St
- 6644 Burkett St
- 6617 Del Rio St Unit B
- 6920 Winton St
- 6336 Del Rio St
- 0 Cadillac St
- 6614 Tierwester St
- 6622 Tierwester St
- 6610 Tierwester St
- 6626 Tierwester St
- 6627 Winton St
- 6611 Winton St
- 3603 Alsace St
- 6606 Tierwester St
- 6630 Tierwester St
- 3602 Alsace St
- 6631 Winton St
- 6618 Winton St
- 3607 Alsace St
- 6605 Winton St
- 6614 Winton St
- 6634 Tierwester St
- 6602 Tierwester St
- 3606 Alsace St
- 6622 Winton St
- 6610 Winton St