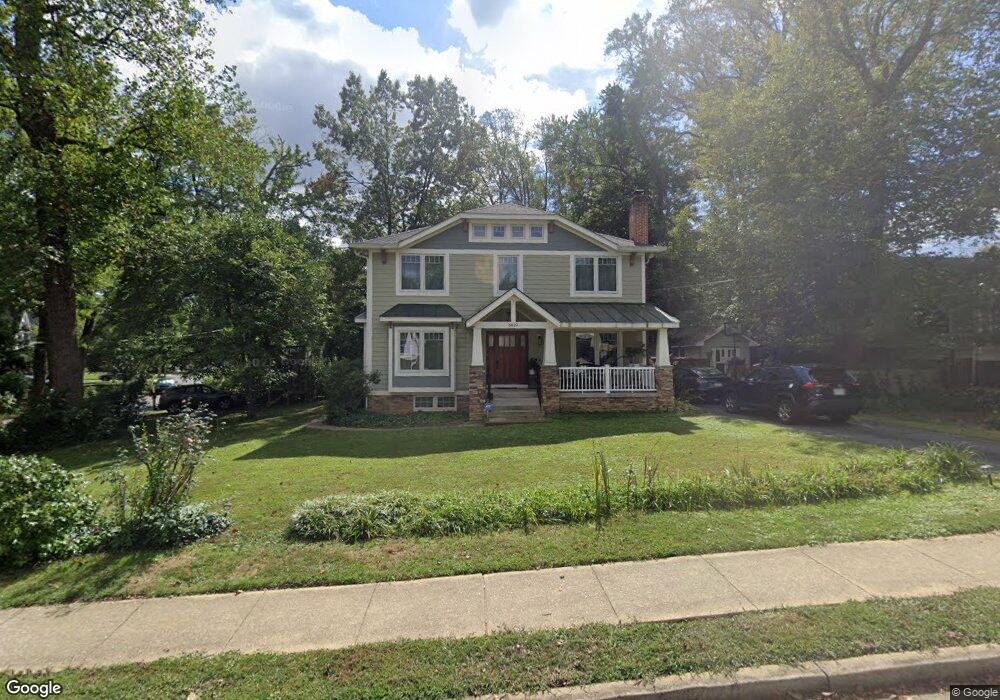
6619 Moly Dr Falls Church, VA 22046
Estimated Value: $1,373,000 - $1,611,000
4
Beds
3
Baths
2,674
Sq Ft
$557/Sq Ft
Est. Value
About This Home
This home is located at 6619 Moly Dr, Falls Church, VA 22046 and is currently estimated at $1,489,626, approximately $557 per square foot. 6619 Moly Dr is a home located in Fairfax County with nearby schools including Haycock Elementary School, Longfellow Middle School, and Acton Academy Falls Church.
Ownership History
Date
Name
Owned For
Owner Type
Purchase Details
Closed on
Dec 7, 2012
Sold by
Orchid Est Llc
Bought by
2217 Orchard Dr Llc
Current Estimated Value
Home Financials for this Owner
Home Financials are based on the most recent Mortgage that was taken out on this home.
Original Mortgage
$840,000
Outstanding Balance
$584,444
Interest Rate
3.46%
Mortgage Type
Construction
Estimated Equity
$905,182
Purchase Details
Closed on
May 27, 1999
Sold by
Hardy George L
Bought by
Opem Richard P
Home Financials for this Owner
Home Financials are based on the most recent Mortgage that was taken out on this home.
Original Mortgage
$172,000
Interest Rate
6.82%
Create a Home Valuation Report for This Property
The Home Valuation Report is an in-depth analysis detailing your home's value as well as a comparison with similar homes in the area
Home Values in the Area
Average Home Value in this Area
Purchase History
| Date | Buyer | Sale Price | Title Company |
|---|---|---|---|
| 2217 Orchard Dr Llc | $520,000 | -- | |
| Opem Richard P | $215,000 | -- |
Source: Public Records
Mortgage History
| Date | Status | Borrower | Loan Amount |
|---|---|---|---|
| Open | 2217 Orchard Dr Llc | $840,000 | |
| Previous Owner | Opem Richard P | $172,000 |
Source: Public Records
Tax History Compared to Growth
Tax History
| Year | Tax Paid | Tax Assessment Tax Assessment Total Assessment is a certain percentage of the fair market value that is determined by local assessors to be the total taxable value of land and additions on the property. | Land | Improvement |
|---|---|---|---|---|
| 2025 | $14,670 | $1,282,270 | $540,000 | $742,270 |
| 2024 | $14,670 | $1,241,610 | $540,000 | $701,610 |
| 2023 | $13,167 | $1,143,460 | $500,000 | $643,460 |
| 2022 | $12,465 | $1,068,570 | $441,000 | $627,570 |
| 2021 | $12,097 | $1,011,020 | $441,000 | $570,020 |
| 2020 | $11,843 | $981,560 | $432,000 | $549,560 |
| 2019 | $11,766 | $975,210 | $432,000 | $543,210 |
| 2018 | $10,666 | $927,460 | $415,000 | $512,460 |
| 2017 | $11,089 | $936,580 | $413,000 | $523,580 |
| 2016 | $10,928 | $924,920 | $413,000 | $511,920 |
| 2015 | $10,083 | $885,230 | $393,000 | $492,230 |
| 2014 | $9,819 | $864,010 | $385,000 | $479,010 |
Source: Public Records
Map
Nearby Homes
- 6616 Fisher Ave
- 2221 Orchid Dr
- 6613 Fisher Ave
- 2300 Meridian St
- 6601 Gordon Ave
- 6712 Moly Dr
- 2302 Westmoreland St
- 6703 Hallwood Ave
- 6707 Hallwood Ave
- 6545 Placid St
- 2125 Hilltop Place
- 6610 Quinten St
- 2231 N Tuckahoe St
- 6609 Rockmont Ct
- 6616 Kirby Ct
- 6607 Midhill Place
- 3019 N Tuckahoe St
- 6449 Orland St
- 2202 Grayson Place
- 2240 Highland Terrace