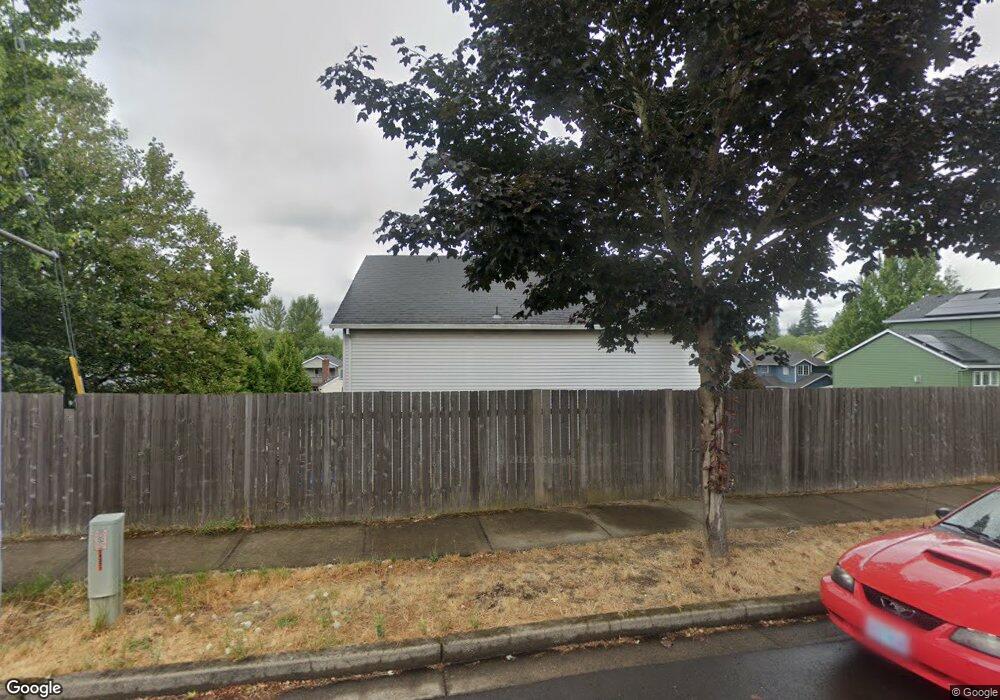
6619 SE Borwick St Hillsboro, OR 97123
Southeast Hillsboro NeighborhoodEstimated Value: $459,000 - $507,000
4
Beds
3
Baths
1,478
Sq Ft
$328/Sq Ft
Est. Value
About This Home
This home is located at 6619 SE Borwick St, Hillsboro, OR 97123 and is currently estimated at $485,228, approximately $328 per square foot. 6619 SE Borwick St is a home located in Washington County with nearby schools including Imlay Elementary School, R.A. Brown Middle School, and Century High School.
Ownership History
Date
Name
Owned For
Owner Type
Purchase Details
Closed on
Mar 12, 2010
Sold by
Lamont John W and Lamont Susan N
Bought by
Lamont Properties Llc
Current Estimated Value
Purchase Details
Closed on
Jun 17, 2009
Sold by
Lamont Properties Llc
Bought by
Lamont John W and Lamont Susan N
Home Financials for this Owner
Home Financials are based on the most recent Mortgage that was taken out on this home.
Original Mortgage
$111,500
Interest Rate
4.82%
Mortgage Type
Unknown
Purchase Details
Closed on
Feb 22, 2001
Sold by
Lamont John W
Bought by
Lamont John W and Lamont Susan N
Home Financials for this Owner
Home Financials are based on the most recent Mortgage that was taken out on this home.
Original Mortgage
$120,000
Interest Rate
6.89%
Mortgage Type
Construction
Create a Home Valuation Report for This Property
The Home Valuation Report is an in-depth analysis detailing your home's value as well as a comparison with similar homes in the area
Home Values in the Area
Average Home Value in this Area
Purchase History
| Date | Buyer | Sale Price | Title Company |
|---|---|---|---|
| Lamont Properties Llc | -- | None Available | |
| Lamont John W | -- | First American | |
| Lamont John W | -- | First American Title Ins Co |
Source: Public Records
Mortgage History
| Date | Status | Borrower | Loan Amount |
|---|---|---|---|
| Previous Owner | Lamont John W | $111,500 | |
| Previous Owner | Lamont John W | $120,000 |
Source: Public Records
Tax History Compared to Growth
Tax History
| Year | Tax Paid | Tax Assessment Tax Assessment Total Assessment is a certain percentage of the fair market value that is determined by local assessors to be the total taxable value of land and additions on the property. | Land | Improvement |
|---|---|---|---|---|
| 2025 | $3,956 | $242,010 | -- | -- |
| 2024 | $3,843 | $234,970 | -- | -- |
| 2023 | $3,843 | $228,130 | $0 | $0 |
| 2022 | $3,739 | $228,130 | $0 | $0 |
| 2021 | $3,664 | $215,040 | $0 | $0 |
| 2020 | $3,585 | $208,780 | $0 | $0 |
| 2019 | $3,482 | $202,700 | $0 | $0 |
| 2018 | $3,333 | $196,800 | $0 | $0 |
| 2017 | $3,212 | $191,070 | $0 | $0 |
| 2016 | $3,124 | $185,510 | $0 | $0 |
| 2015 | $2,998 | $180,110 | $0 | $0 |
| 2014 | $2,981 | $174,870 | $0 | $0 |
Source: Public Records
Map
Nearby Homes
- 6751 SE Madison St
- 6461 SE Maple St
- 6417 SE Maple St
- 6641 SE Wrenfield St
- 6874 SE Ariel St
- 6550 SE Wrenfield St
- 818 SE 68th Place
- 6273 SE Heike St
- 6194 SE Maple St
- 862 SE 63rd Dr
- 6204 SE Sigrid St
- 573 SE 73rd Ave
- 6538 NE Forest Ln
- 7082 SE Lois St
- 7200 SE Harnish St
- 6428 SE Austin Ct
- 155 NE Woodsong St
- 7259 SE Harnish St
- 146 NE Woodsong St
- 6209 NE Dereck Ln
- 6635 SE Borwick St
- 6651 SE Borwick St
- 6551 SW Borwick
- 450 SE 66th Ct
- 444 SE 66th Ct
- 432 SE 66th Ct
- 6675 SE Borwick St
- 438 SE 66th Ct
- 6676 SE Borwick St
- 550 SE 66th Ave
- 6693 SE Borwick St
- 435 SE 68th Ave
- 426 SE 66th Ct
- 441 SE 68th Ave
- 420 SE 66th Ct
- 555 SE 66th Ave
- 414 SE 66th Ct
- 6717 SE Borwick St
- 402 SE 66th Ct
- 429 SE 68th Ave